
Smash factor is the primary limiter of consistent distance and dispersion. Raise it by improving center-face contact and proper sequencing, and your shot-to-shot variance tightens without touching clubhead speed. Tour averages sit near 1.49 smash factor; most serious amateurs cluster around 1.44–1.48. The gap between those numbers is almost entirely a contact and timing story, not a fitness story.
Three things to check right now:
- Pull your last simulator session and find your mean smash factor across the full round of shots, not just your best.
- Check your impact location data or stick impact tape on the face for 20–30 swings to map your miss pattern.
- Compare smash variance (standard deviation) across blocks, not peak smash. A high peak with wide variance is a warning sign, not a win.
Record one short simulator session, 30–50 shots, and note your mean smash and SD before doing anything else.
Table of Contents
- How impact efficiency drives your consistency
- Why impact efficiency is the bottleneck for consistency
- Which simulator metrics actually tell you about impact efficiency
- Simulator diagnostic checklist: what the data is telling you
- A short practice progression to improve impact efficiency
- How to design simulator sessions that prove improvement
- Realistic timeline and what equipment you actually need
- Key Takeaways
- What I'd actually prioritize with a low-smash player
- Sim2coursecaddie makes this progression measurable
- Useful sources and further reading
How impact efficiency drives your consistency
Smash factor equals ball speed divided by clubhead speed. It is the most direct measure of energy transfer at impact, and improving it requires center-face contact and correct sequencing rather than simply swinging harder. Think of it as a chain: ground reaction forces load the lower body, the lower body sequences into torso rotation, the torso drives arm and hand delivery, and all of that arrives at the clubface at contact. A break anywhere in that chain leaks energy and moves the strike off-center.
The role of impact efficiency in consistency is direct: when you deliver the face to the same spot at the same angle repeatedly, ball speed and launch conditions replicate. Dispersion tightens as a result. Off-center strikes scatter launch angle, spin rate, and carry distance simultaneously, which is why two shots hit at identical clubhead speed can land 30 yards apart.
Pro Tip: Track smash factor mean and SD across every session block, not just the session total. A block of 10 shots with mean 1.46 and SD 0.02 tells you far more than a session best of 1.51.
Why impact efficiency is the bottleneck for consistency
Research on elite versus skilled golfers finds that repeatability alone does not separate professionals from serious amateurs. What separates them is the level of impact factors: professionals achieve higher smash factor and clubhead speed, and their consistency advantage comes from sustaining that quality, not just repeating a mediocre pattern. Optimize contact quality first, then train repeatability.
Off-center strikes and poor timing leak energy in measurable ways. A smash factor improvement of 0.05 at the same clubhead speed adds roughly 10–15 yards of carry. That is not a marginal gain; it is the difference between a comfortable approach and a scramble.
| Smash Factor Range | Contact Quality | Typical Carry Effect | Dispersion Risk |
|---|---|---|---|
| Below 1.40 | Poor — contact or delivery fault | Significant carry loss | High lateral scatter |
| 1.40–1.44 | Below average for amateurs | Moderate carry loss | Elevated dispersion |
| 1.44–1.48 | Solid amateur range | Near-optimal carry | Manageable variance |
| Near 1.49 | Tour-level contact | Maximum carry for speed | Tight dispersion |
A session where your mean smash is below solid amateur range with noticeably high variance tells you two things: your average contact is costing you carry, and your variance is adding directional scatter on top of that.
Which simulator metrics actually tell you about impact efficiency
Not every number on your launch monitor screen measures contact quality directly. Two metrics are primary: smash factor and impact location (face X/Y coordinates). Everything else is downstream.
Secondary metrics that reflect efficiency indirectly:
- Ball speed: the product of smash factor × clubhead speed; rises when contact improves even if swing speed stays flat.
- Launch angle and dynamic loft: off-center strikes alter effective loft at contact, producing inconsistent launch.
- Spin rate: toe and heel strikes add or remove spin axis tilt, driving left-right dispersion.
- Carry SD and lateral SD: the aggregate result of all the above; useful as a session-level health check.
Typical target ranges for drivers: serious amateurs cluster around 1.44–1.48, while tour players average near 1.49. Irons run lower by design due to loft and face geometry; solid amateur players achieve respectable smash factors with irons. When personal shot data shows a club consistently underperforming its smash benchmark, that is a fitting signal, not just a technique signal.
Pro Tip: Use paired blocks of 10 shots each. Change one variable between blocks (e.g., ball position) and compare mean smash and SD. Single-variable block testing cuts through session noise faster than reviewing a 60-shot average.

Simulator diagnostic checklist: what the data is telling you
Map your simulator signature to a likely cause before changing anything.
| Sim Signature | Likely Cause | First Action |
|---|---|---|
| Low smash + toe impact marks | Off-center toe strikes | Impact tape for 20–30 shots; gate drill to widen path |
| Low smash + normal club speed | Early release or weight-transfer mistiming | Foot-tap timing drill; check F1/F2 force timing |
| High spin + heel marks | Heel contact, face closing through impact | Impact tape; path-to-face alignment check |
| Wide lateral SD, smash OK | Inconsistent face angle at delivery | Impact-hold stabilization drill |
| Low ball speed, smash OK | Clubhead speed loss, not contact | Speed training block; check sequencing |
| Smash varies wildly block-to-block | Sequencing inconsistency | Slow-motion rehearsal; reduce tempo |
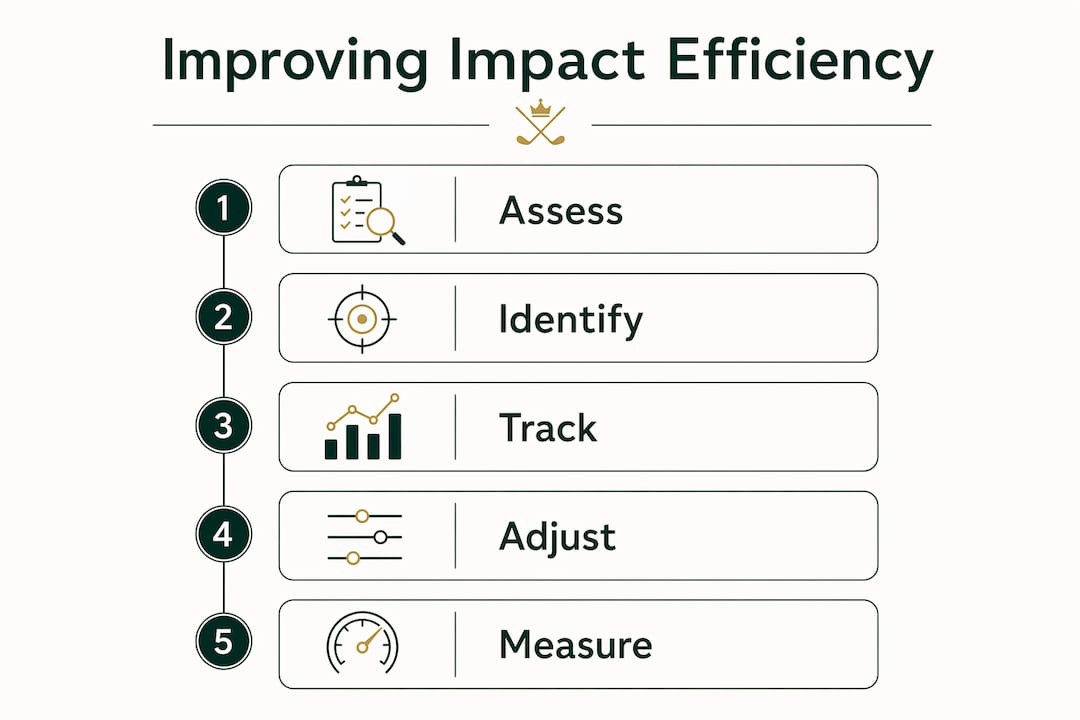
Start with tracking your misses before overhauling anything. Impact tape costs a few dollars and often reveals a consistent miss pattern that a single technique change can address. Force-plate analysis and equipment changes come after you know where you are actually striking the ball.
A short practice progression to improve impact efficiency
Work through this in order. Each phase builds on the last.
- Impact-tape warmup (every session). Apply tape, hit 10 shots, read the pattern. This is your daily diagnostic, not a one-time fix.
- Gate drill (weeks 1–2). Set two tees just outside the toe and heel of the club. Hit 3×10 blocks aiming to miss both gates. Tracks path and face delivery simultaneously.
- Foot-tap timing drill (weeks 1–3). Vertical force timing at impact drives center contact. Tap the lead foot at the start of the downswing to train F1 loading; it slows the transition and improves sequencing.
- Impact-hold stabilization (weeks 2–4). Swing to impact and hold the position for two seconds. Builds awareness of face angle and body position at contact.
- Slow-motion rehearsal (ongoing). Half-speed swings focusing on the sequence: ground load → lower body → torso → arms. Three reps before each full-speed block.
- Small-target flushing sets (weeks 3–4). Hit 5×6 shot blocks to a specific target. Log mean smash and SD per block. Compare blocks, not sessions.
Session-tracking template:
Review session notes after each block, not just at the end of the session.
How to design simulator sessions that prove improvement
A baseline session of 50 shots with a single club gives you the reference point everything else is measured against. Log mean smash, SD smash, and percent center-contact from impact tape or face-mapping data.
Run weekly tracked blocks of 30–50 shots using the same club and conditions. A meaningful improvement involves measurable increases in mean smash, reductions in variance, and more frequent center-face contacts. That combination translates to roughly 6–10 yards of additional carry and noticeably tighter lateral dispersion. A single-shot improvement of 0.05 means nothing without the SD moving with it.
Paired-block comparisons cut through noise faster than session-to-session averages. Change one variable between adjacent blocks, keep everything else identical, and compare the two sets. Multi-session aggregation reduces measurement noise further: three sessions of 50 shots gives you 150 data points, which is enough to see real trends in mean and SD.
Sample sizes matter. Fewer than 20 shots per block makes SD unreliable. Thirty shots is the practical minimum for a meaningful smash-factor mean.
Realistic timeline and what equipment you actually need
Initial contact feel improvements typically arrive after some weeks of structured practice. Measurable ball-speed and smash-factor gains usually show up when training combines technique work with physical capacity development. Technique changes alone, without addressing strength and mobility, tend to plateau earlier.
Three cost brackets:
- Public simulator bay or range with a launch monitor: $20–40 per session. Enough to run the full diagnostic and progression. No hardware investment required.
- Home setup with a budget launch monitor (Garmin Approach R10 or similar): $500–600 one-time. Enables daily tracking and paired-block testing without session fees.
- Full home launch monitor plus Sim2coursecaddie: adds session import, 3D visualization, and trend analytics on top of raw hardware data. Free tier covers analytics; Pro subscription unlocks live GPS caddie features at $1/month or $9.99/year.
Invest in technique gains before hardware. Impact tape and a public simulator bay will tell you more in two weeks than a new driver fitting will.
Key Takeaways
Impact efficiency, measured as smash factor, is the single biggest lever for tightening shot-to-shot consistency: improve center-face contact and sequencing first, and dispersion follows.
| Point | Details |
|---|---|
| Smash factor is the primary metric | Track mean and SD across blocks, not session bests; target 1.44–1.48 for driver as a serious amateur. |
| Contact quality beats raw speed | A 0.05 smash-factor gain at the same clubhead speed adds roughly 10–15 yards of carry. |
| Diagnose before you change anything | Use impact tape for 20–30 shots to map your miss pattern before adjusting technique or equipment. |
| Sequencing drives efficiency | Foot-tap and impact-hold drills address F1/F2 timing faults that cause off-center strikes. |
| Sim2coursecaddie tracks your progress | Import session data to monitor mean smash, SD, and impact-location trends across your four-week progression. |
What I'd actually prioritize with a low-smash player
The conventional advice is to fix the swing first and let the numbers follow. That is backwards. When a player shows low smash factor with normal clubhead speed, the first question is not "what is wrong with the swing?" It is "where is the ball actually hitting the face?" Most golfers genuinely do not know. They assume center contact because the shot felt okay, but impact tape almost always reveals a consistent miss pattern that is two inches from where they thought.
Once you know the miss location, the cause narrows fast. Toe misses with normal speed usually point to early extension or path issues. Heel misses with low smash often trace back to standing up through impact. Both are sequencing problems, not grip or alignment problems. The foot-tap drill and impact-hold work address the root cause directly.
The caution I would add: chasing a higher smash number by swinging harder is one of the most reliable ways to make contact worse. Speed without stability moves the strike off-center, and the net result is lower ball speed, not higher. Build contact quality first. Speed gains that come from better sequencing will show up in the data without you hunting for them.
Sim2coursecaddie makes this progression measurable
If you are running this four-week progression without a way to aggregate and compare sessions, you are relying on memory and gut feel. That is where most improvement stalls.

Sim2coursecaddie imports shot data from any simulator or launch monitor, plots your strikes in a 3D range, and tracks mean smash, SD, and dispersion trends across sessions. The golf GPS caddie features extend that data to the course itself, giving you AI-driven club recommendations built from your actual impact efficiency numbers. The free tier covers analytics and session visualization. The Pro subscription, at $1/month or $9.99/year, adds live GPS and real-time conditions. Import your first session and run the baseline diagnostic today.
Useful sources and further reading
- Common consistency killers data reveals for golfers — how impact efficiency patterns show up in shot logs
- Drill effectiveness tracking: real examples for golfers — session-by-session drill outcome tracking with real data
- Golf data analysis best practices for serious golfers — how to structure session exports and read trends
- Shot-by-shot data logging: a golfer's 2026 guide — step-by-step logging and export workflow
- Sim2coursecaddie product page — full feature list and free tier access