
Drill effectiveness tracking is the systematic measurement of practice drill outcomes using quantifiable metrics to determine whether a golfer is actually improving. Most golfers practice without tracking anything, which means they repeat the same mistakes without knowing it. The best examples of drill effectiveness tracking combine shot accuracy, consistency scores, and session-over-session progression data collected through simulators and analytics tools like Sim2coursecaddie. Moving from gut feel to objective measurement is the single biggest shift a serious golfer or trainer can make.
What quantifiable metrics are used in drill effectiveness tracking?
The most reliable drill performance metrics are shot accuracy, dispersion, and progression rate. Shot accuracy measures how close each shot lands to a defined target. Dispersion tracks how tightly grouped your shots are across a session. Progression rate compares your average performance across multiple sessions to show whether you are improving, plateauing, or regressing.
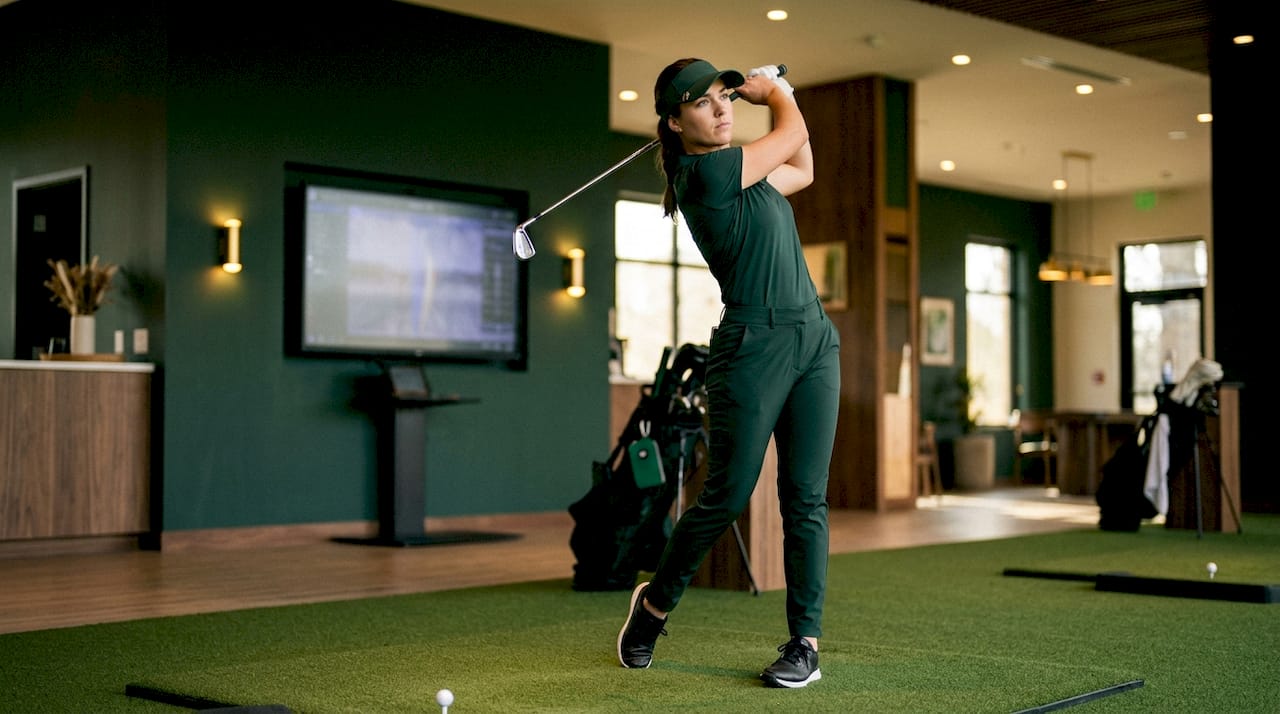
Tracking these metrics requires consistent data collection. A simulator or launch monitor captures ball speed, launch angle, carry distance, and spin rate on every shot. Without that data, you are estimating.
Key metrics worth tracking in every drill session:
- Shot accuracy: Distance from target in yards or feet, averaged across all attempts
- Dispersion radius: The spread of shot landing zones, measured as a circle diameter
- Swing speed consistency: Variance in club head speed across repeated swings
- Ball speed: Directly tied to strike quality and energy transfer
- Launch angle: Reveals whether contact and loft are consistent
- Carry distance variance: Shows how repeatable your swing is under identical conditions
Moving from subjective feelings to objective tracking through specific KPIs is the only way to spot performance gaps before they become ingrained habits. That principle applies directly to golf: without a number, you cannot know whether a drill is working.
Pro Tip: Set a target dispersion radius before each drill session. If your 7-iron shots land within a 15-foot circle by the end of the session but started at 30 feet, that is measurable proof the drill worked.
How technology improves measuring drill effectiveness
Simulators and analytics platforms have made drill assessment techniques far more precise than paper logs or video alone. A quality simulator captures dozens of data points per shot automatically, removing the human error that comes with manual recording.
"Automating data entry is not just a time-saver. It is essential for accuracy and producing insights you can actually act on. Manual logs introduce inconsistency that corrupts your trend data over weeks and months."
Automated data entry improves accuracy in ways that matter for performance optimization. A single misrecorded session can skew a month of trend analysis.
Technology-driven tracking delivers these specific advantages:
- Real-time feedback: You see shot data immediately, not after the session ends
- Automated logging: Every shot is recorded without manual input
- Trend visualization: Dashboards show performance curves across sessions
- Club-by-club breakdowns: Separate data streams for each club reveal specific weaknesses
- Condition tagging: Sessions can be labeled by fatigue level, time of day, or drill type
Sim2coursecaddie imports shot data from any golf simulator and displays it in a 3D driving range visualization. Golfers can see exactly where each shot landed, how their dispersion changed across a session, and which clubs underperform relative to their own historical averages. The role of data visualization in spotting trends is significant. A number in a spreadsheet is easy to ignore. A visual cluster of shots drifting left over 20 attempts is impossible to dismiss.
1. Shot-by-shot data logging
Shot-by-shot logging is the foundation of all drill tracking examples. Every attempt in a drill session gets recorded with its outcome metrics: carry distance, deviation from target, and ball speed. Over a 50-shot session, you build a dataset that reveals patterns no single shot could show. Sim2coursecaddie automates this process when connected to a simulator, so golfers focus on swinging rather than recording.
2. Weekly session comparisons
Comparing this week's session data against last week's is one of the clearest ways to measure drill effectiveness over time. Weekly session comparisons reveal whether your average shot accuracy improved, stayed flat, or declined. A trainer can use this data to decide whether to advance a drill to a harder variation or repeat it at the same difficulty.
3. Tracking multiple clubs to find weaknesses
Most golfers practice their favorite clubs and avoid the ones they struggle with. Tracking multiple clubs across every session exposes exactly which clubs underperform relative to the rest of the bag. A golfer might discover their 4-iron dispersion is three times wider than their 6-iron, pointing to a specific technique gap worth drilling.
4. Controlled standardized drills
Controlled field tests under consistent parameters establish objective performance baselines. The same principle applies directly to golf. A standardized drill uses the same target, same club, same number of attempts, and same starting position every session. Changing any variable makes session-to-session comparison unreliable. Standardization is what separates a training drill from casual hitting.
Pro Tip: Run your baseline drill at the start of every session before fatigue sets in. This gives you a clean, comparable data point each week.
5. KPI-based performance dashboards
Real-time KPIs allow early detection of performance loss before it becomes a costly problem to fix. In golf, a dashboard showing swing speed, ball speed, and launch angle across 10 sessions lets a trainer spot a downward trend after two sessions rather than after two months. Sim2coursecaddie's analytics dashboard gives golfers this visibility without requiring a coaching staff. You can build a performance dashboard directly from your home simulator data.
6. Efficiency metrics over raw distance
Raw distance is the most overrated metric in golf practice. A golfer who hits 280 yards with high spin variance is less efficient than one who hits 260 yards with tight, repeatable spin. Efficiency metrics focus on how much useful output you get per unit of effort. Lower variance in spin rate and launch angle signals a more efficient, repeatable swing. This mirrors the principle that lower specific energy indicates higher efficiency, not just higher output.
7. Longitudinal trend analysis
Single-session data tells you what happened today. Longitudinal data tells you whether you are actually getting better. Tracking drill performance across 8–12 weeks reveals whether improvements are real or just day-to-day variation. A trainer using longitudinal analysis can distinguish a genuine skill gain from a lucky session. Automating your home simulator tracking makes longitudinal data collection effortless.
How to interpret drill effectiveness data to improve training
Raw data only helps when you know what to do with it. The first step is separating patterns from outliers. One bad session does not indicate a problem. Three consecutive sessions with declining accuracy does.
Key interpretation principles for golfers and trainers:
- Set benchmarks before the drill begins. A target like "land 70% of shots within 10 feet of the pin" gives you a clear pass or fail standard.
- Distinguish signal from noise. A single outlier session should be noted but not acted on. A trend across three or more sessions demands a response.
- Adjust drill difficulty based on data. If a golfer hits the accuracy benchmark in four consecutive sessions, the drill is too easy. Increase the difficulty or change the target.
- Combine objective data with subjective feel. A golfer who reports feeling uncomfortable with a swing change but shows improving data is on the right track. The data overrides the feeling.
Operational leaders recommend focusing on specific, quantifiable KPIs to enable objective tracking and early problem detection. Trainers who apply this discipline to golf practice give their golfers a measurable path to improvement rather than vague encouragement.
Common pitfalls and best practices in drill tracking
The most common mistake in drill efficiency evaluation is tracking raw scores without context. A golfer who improves their average carry distance by 10 yards in summer but loses 15 yards of accuracy has not improved overall. Context turns numbers into decisions.
| Pitfall | Best Practice |
|---|---|
| Tracking only one metric | Measure accuracy, consistency, and speed together |
| Changing drill conditions each session | Standardize target, club, and attempt count |
| Ignoring longitudinal data | Keep at least 8 weeks of session records |
| Relying only on feel | Pair subjective notes with objective shot data |
| Acting on a single session | Identify trends across 3 or more sessions before changing drills |
Environmental consistency matters as much as data consistency. A drill run indoors on a simulator produces different numbers than the same drill on a windy range. Keep conditions as stable as possible, or tag sessions with condition notes so you can filter the data correctly.
Key Takeaways
The most effective drill tracking combines standardized conditions, quantifiable KPIs, and longitudinal data reviewed across multiple sessions to produce reliable performance signals.
| Point | Details |
|---|---|
| Use quantifiable KPIs | Track shot accuracy, dispersion, and ball speed every session for objective measurement. |
| Standardize drill conditions | Same target, club, and attempt count each session makes comparisons valid. |
| Review trends, not single sessions | Meaningful improvement shows up across 3 or more sessions, not one. |
| Automate data collection | Automated logging removes human error and produces cleaner trend data. |
| Combine data with subjective notes | Objective metrics plus feel notes give trainers the full picture. |
What I've learned from integrating simulator data into real training
Most golfers I work with come in thinking they know their weaknesses. They almost always name the wrong club. When we pull their simulator data across six weeks, the actual problem is usually a different club entirely, or a specific shot shape they never noticed because they were not tracking it.
The metric that gives the clearest signal, in my experience, is dispersion radius over time. It is harder to fake than distance. A golfer can muscle a few long shots in a session, but a tight dispersion radius across 40 shots means the swing is genuinely repeatable. That is the number I watch first.
My recommendation for trainers: do not wait until you have a perfect data setup. Start with two metrics, shot accuracy and dispersion, and track them consistently for four weeks. The patterns you find will tell you exactly which drills to keep and which to drop. Technology like Sim2coursecaddie makes this easier, but the discipline of consistent measurement matters more than the tool you use.
— Jeff
Sim2coursecaddie puts drill tracking data to work
Golfers who want to move from guessing to knowing need a system that collects, stores, and displays their drill data automatically.

Sim2coursecaddie imports shot data from any golf simulator and turns it into clear performance dashboards. You see shot accuracy, dispersion trends, and club-by-club breakdowns without building a spreadsheet. The app's AI-driven club recommendations use your actual historical data to suggest the right club for real course conditions. It is available for free, with no hardware requirement and no costly subscription. Golfers who want more depth can upgrade their analytics access to unlock advanced tracking features built for serious improvement.
FAQ
What are the best metrics for tracking drill effectiveness in golf?
Shot accuracy, dispersion radius, and ball speed are the three most reliable metrics. Tracking all three together gives a complete picture of drill performance.
How often should golfers review their drill tracking data?
Review data after every session for immediate feedback, and compare weekly trends across at least four sessions before changing a drill.
Does simulator data translate to real on-course performance?
Yes. Simulator data captures the same ball flight metrics as outdoor play. Consistent improvement in simulator drill metrics reliably predicts on-course gains.
What is the biggest mistake golfers make when tracking drills?
Acting on a single session rather than a trend. One good or bad session is noise. Three consecutive sessions in the same direction is a signal worth responding to.
Can golfers track drill effectiveness without a coach?
Golfers can track drill effectiveness independently using a simulator and an analytics app like Sim2coursecaddie. The data replaces the need for a coach to observe every session manually.