
Weekly session comparisons are defined as the practice of measuring golf performance metrics across consecutive seven-day periods to identify meaningful changes in shot quality, consistency, and club behavior. This method gives data-driven golfers a direct window into their improvement trajectory. The ±20% change threshold, year-over-year benchmarking, and 4-week rolling averages are the three analytical standards that make weekly performance analysis reliable rather than reactive. Sim2coursecaddie applies these principles to simulator data, turning raw shot numbers into a clear picture of where your game is actually moving.
How weekly session comparisons reveal growth in golf performance
Weekly comparisons are the optimal analysis frequency for spotting rapid, actionable patterns that monthly reports routinely obscure. A monthly review averages out the week you finally dialed in your 7-iron alongside the week you were fighting a slice. The result looks flat. A weekly review shows you exactly when the shift happened and what changed.
The technical term for this practice is week-over-week (WoW) analysis. It compares a defined metric from one seven-day window to the same metric from the prior seven-day window. For golfers, that metric might be average carry distance, shot dispersion width, or the percentage of shots landing within a target zone. The WoW framework is borrowed from digital analytics but maps cleanly onto golf practice data.
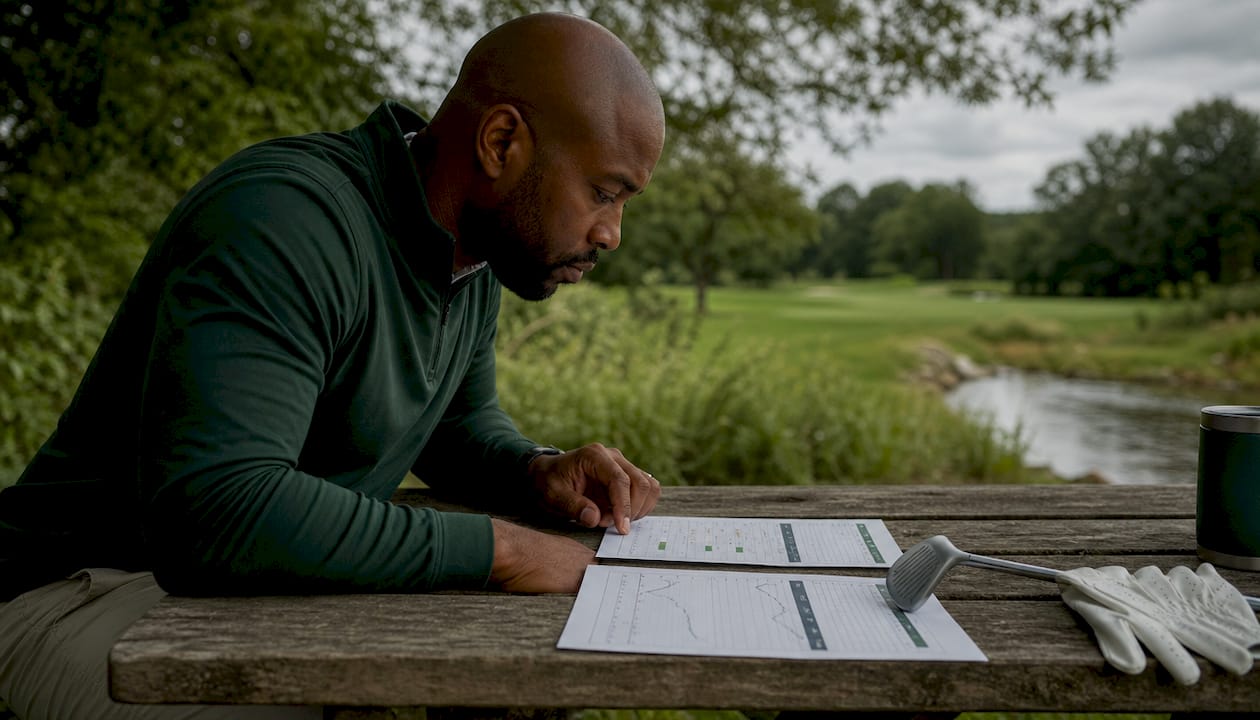
Weekly reviews also create a feedback loop tight enough to act on. If your average session duration dropped sharply, you can adjust your next practice before a bad habit sets in. Monthly reviews deliver that same signal six weeks too late.
Pro Tip: Set a fixed day and time each week to run your session comparison. Consistency in your review schedule is as important as consistency in your swing.
Why weekly analysis beats monthly or daily reviews
Daily snapshots produce noise, not trends. One poor session after a long workday tells you nothing about your skill trajectory. One exceptional session after a full night's sleep tells you just as little. Single-week snapshots mislead; a 4-week rolling average smooths that volatility and reveals what is actually developing underneath.
Monthly reports have the opposite problem. They compress too much data into a single number. A golfer who improved steadily for three weeks and then had one rough week will see a mediocre monthly average. The improvement story disappears entirely.
Weekly analysis sits in the productive middle. It captures enough data to filter out one-off noise while staying close enough to your practice to inform your next session. The cadence also fits naturally into most golfers' practice schedules, which tend to cluster around weekends.
- Weekly reviews catch meaningful shifts before they become entrenched habits
- Monthly reviews arrive too late to redirect practice focus
- Daily data reflects external variables more than actual skill change
- A 4-week rolling average alongside weekly data gives both granularity and stability
Pro Tip: When a weekly metric looks alarming, check the prior four weeks before changing anything. One bad week inside a positive trend is not a signal. It is noise.
What metrics in weekly session comparisons best reveal growth
Session count alone is a vanity metric. Hitting the simulator five times in a week means nothing if each session was unfocused and short. Growth shows up in session quality: consistent engagement duration, shot volume per session, and the spread of your shot outcomes around a target.
The most revealing metrics to track weekly fall into three categories.
Consistency metrics measure how tightly your shot outcomes cluster. A shrinking dispersion radius week over week is a concrete signal of skill acquisition. If your 6-iron shots are landing within a 15-yard circle this week versus a 22-yard circle last week, that is growth you can quantify.
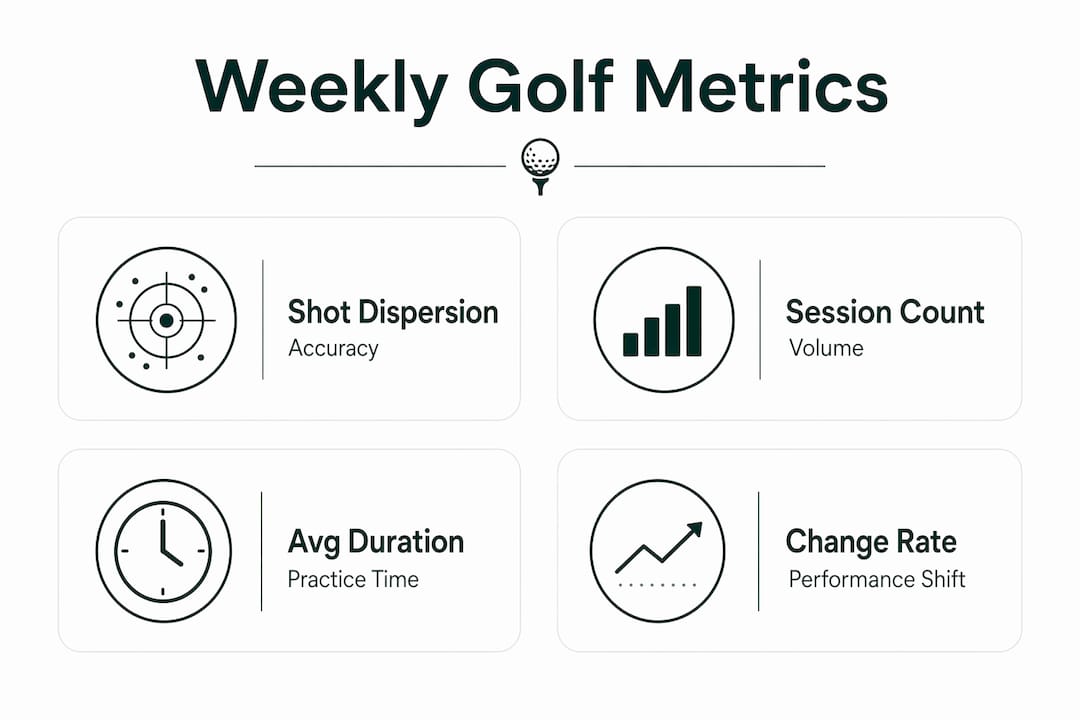
Volume and duration metrics track how much quality practice you are actually logging. Average session duration and shots per session tell you whether your engagement is deepening or drifting. A golfer who averages 45 minutes per session with 80 shots is building more than one who logs 20-minute sessions with 30 shots.
Change-rate metrics flag when something significant has shifted. Any week-over-week change greater than ±20% is a meaningful signal worth investigating. That threshold separates non-random variance from ordinary fluctuation. It applies equally to positive jumps and negative drops.
| Metric | What it reveals | Flag threshold |
|---|---|---|
| Shot dispersion radius | Consistency and accuracy trend | ±20% change WoW |
| Average session duration | Depth of engagement per practice | Drop below prior 4-week average |
| Shots per session | Practice volume and focus | ±20% change WoW |
| Club-specific carry distance | Club-by-club skill development | Sustained shift over 3+ weeks |
Seasonal context matters too. A drop in session frequency during the holiday season is expected. Flagging it as a performance decline without that context produces a false alarm.
Pro Tip: Track your top three "movers" each week: the metrics that improved most and the one that declined most. That short list drives your next practice focus without overwhelming you with data.
How to use year-over-year data to avoid misleading conclusions
Year-over-year comparison remains the gold standard for adjusting weekly data against seasonal patterns. Comparing this week to the same week last year removes the distortion that comes from weather, holidays, work schedules, and course availability. A golfer who sees a 25% drop in session frequency in late december should check whether the same drop appeared in december of the prior year before drawing any conclusions.
Combining three time frames gives you the most complete picture. Week-over-week data shows you what just changed. Month-over-month data shows you the medium-term direction. Year-over-year data tells you whether that direction is real or seasonal. No single frame is sufficient on its own.
Practical steps for integrating year-over-year context into your weekly review:
- Pull the same-week data from the prior year before interpreting any WoW decline
- Note external factors that week: travel, illness, course closures, or equipment changes
- Compare your rolling 4-week average now versus the same 4-week window last year
- Look for patterns that repeat across years. Those are structural, not random
Visualizing trends with overlays makes this easier. Plotting this year's weekly shot dispersion against last year's on the same chart immediately shows whether you are ahead, behind, or tracking the same seasonal curve. Sim2coursecaddie's data export features support this kind of multi-period comparison by giving you access to your full shot history in a format you can analyze across time frames.
What session comparison techniques maximize insight for golfers
The most overlooked technique in tracking session growth is session timeout calibration. Advanced practitioners set custom session timeouts based on their practice style: 45–60 minutes for deliberate, contemplative practice versus 10–15 minutes for rapid drill sequences. Default platform timeouts rarely match how golfers actually practice. Discrepancies over 20% in custom session metrics versus platform defaults often signal a misconfigured timeout, not a real change in behavior.
Multi-session shot tracking is the second technique that separates serious golfers from casual ones. Tracking shots across multiple sessions in a single week, broken down by club, reveals which clubs are improving and which are stagnating. Sim2coursecaddie's multi-session shot tracking captures this data automatically, so you are not manually logging every shot.
A structured weekly review process looks like this:
- Pull your session data every Sunday evening at the same time
- Compare this week's key metrics to last week and to your 4-week rolling average
- Flag any metric that moved more than ±20% in either direction
- Check the same week from the prior year for seasonal context
- Write two sentences: what drove the biggest change, and what you will do differently next session
- File the note. Do not just look at the numbers and close the tab
That last step is the one most golfers skip. Reporting data without stating the "why" and the next steps turns a strategic document into a scorecard nobody acts on. The written note forces you to interpret, not just observe.
Pro Tip: Use club-specific tracking data to identify which club is driving your weekly variance. Often, one club accounts for most of the noise in your overall dispersion numbers.
A rigid weekly review rhythm prevents analysis paralysis. Golfers who review data inconsistently, sometimes daily, sometimes monthly, never build the pattern recognition that comes from seeing the same metrics at the same interval week after week. Consistency in analysis is a skill, just like consistency in your swing.
Key Takeaways
Weekly session comparisons reveal growth by isolating meaningful metric shifts from noise, giving golfers a repeatable, context-aware method to track real skill development.
| Point | Details |
|---|---|
| Weekly cadence is optimal | Weekly reviews catch actionable patterns that monthly reports average out and daily data obscures. |
| Flag the ±20% threshold | Any week-over-week change above ±20% signals a non-random shift worth investigating immediately. |
| Session quality beats count | Engagement duration, shot dispersion, and shots per session reveal more than how often you practiced. |
| Add year-over-year context | Pair weekly data with same-week prior-year data to separate real trends from seasonal patterns. |
| Write the "why" every week | Naming the driver of each change and your next step turns raw data into a plan you will actually follow. |
Why I think most golfers are analyzing their practice data backward
Most golfers I talk to check their session data to feel good about how much they practiced. They count sessions, note that the number went up, and call it progress. That is the wrong question entirely. The right question is whether the quality of each session improved, and whether the trend is holding across multiple weeks.
The ±20% threshold changed how I think about single-week results. Before I understood it, I would overreact to a bad week and underreact to a quietly excellent one. Now I look for the threshold first. If nothing crossed it, I do not change my practice plan. If something did, I investigate before I adjust.
The other mistake I see constantly is ignoring year-over-year context. A golfer who sees a drop in session frequency in november and immediately concludes their motivation is fading has not checked whether the same drop appeared last november. Seasonality is real. It is not a character flaw.
The golfers who improve fastest are not the ones who practice most. They are the ones who review most honestly. They write down what drove each week's result, they note what they will change, and they show up the next week with a specific focus. That discipline compounds. Six months of weekly reviews, done properly, produces a picture of your game that no coach can give you from watching you swing.
— Jeff
Sim2coursecaddie tools that support your weekly growth analysis
Tracking weekly growth requires clean, accessible shot data. Sim2coursecaddie's Raw Data tool captures every shot from your simulator sessions and organizes it by club, distance, and dispersion, giving you exactly the metrics you need for a weekly comparison review.
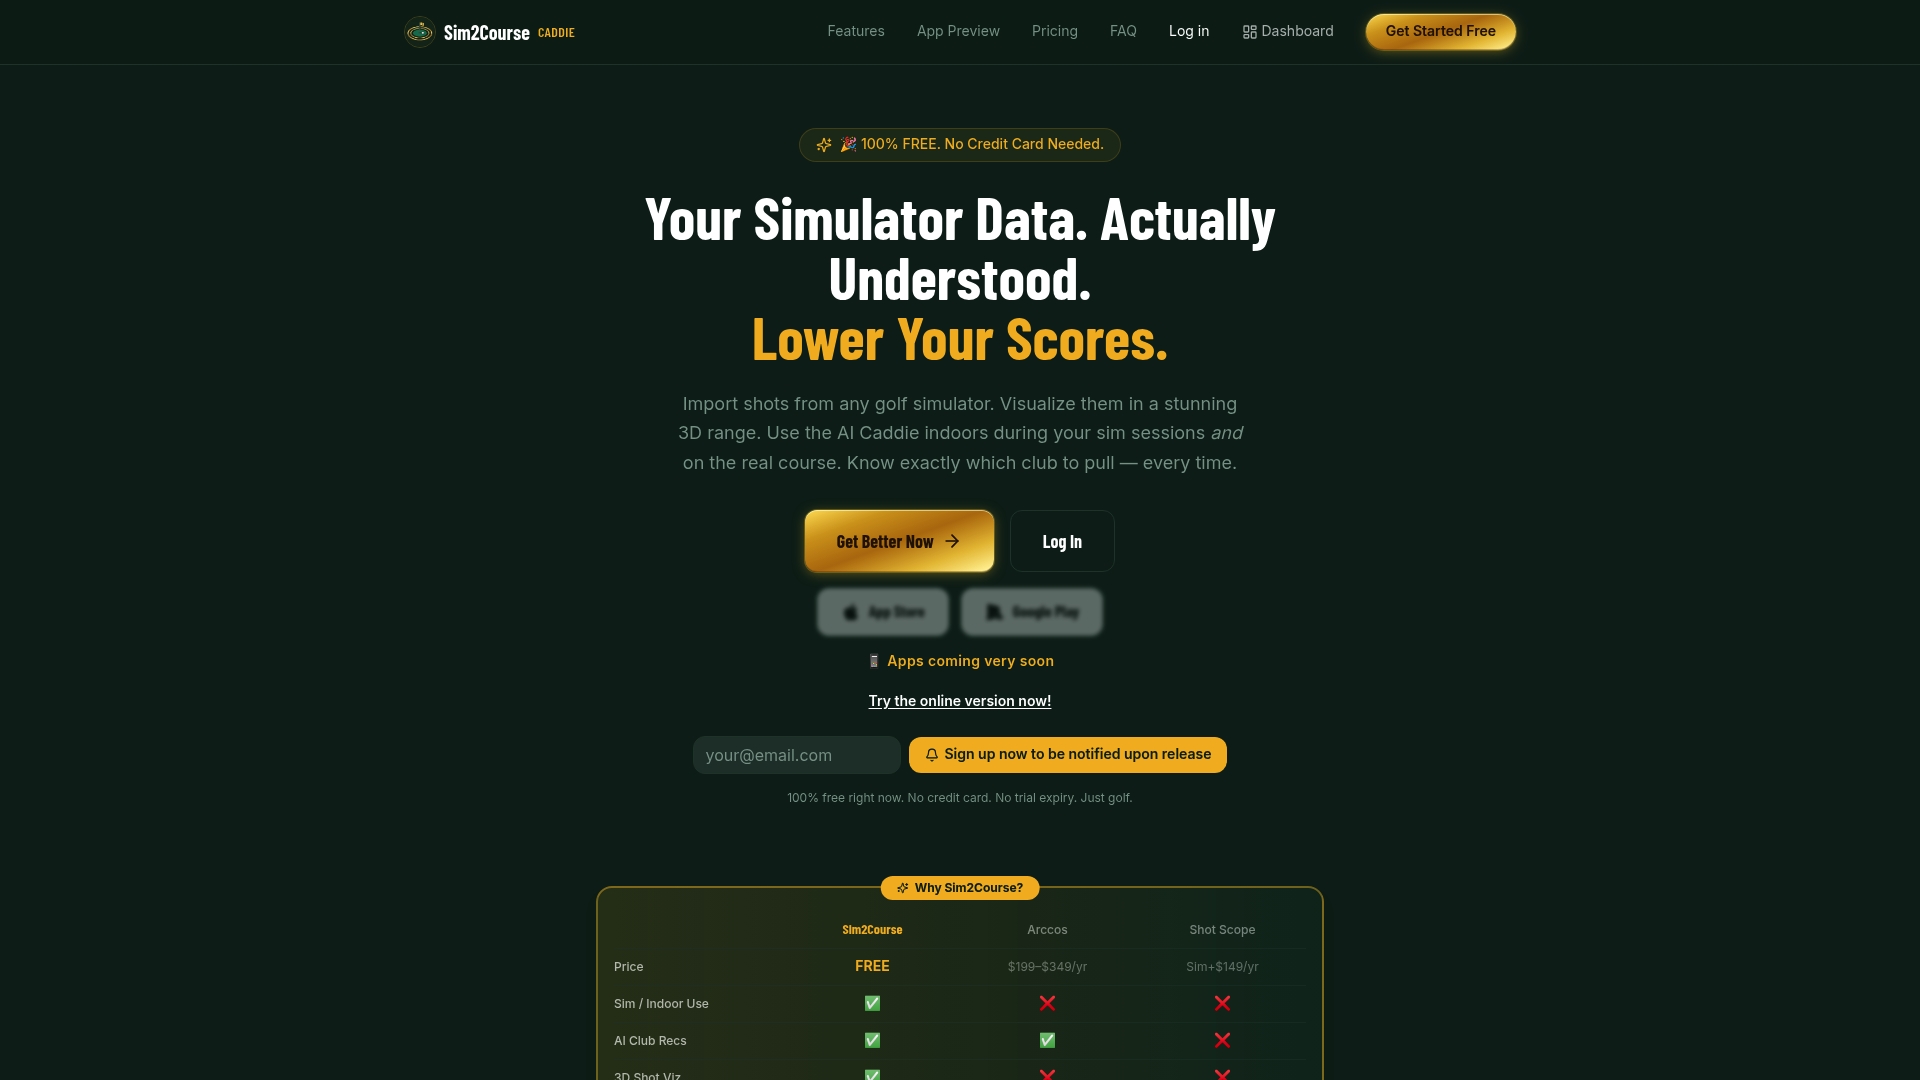
The Range3D feature visualizes your shot patterns in a 3D driving range environment, making it easy to see week-over-week changes in dispersion and trajectory at a glance. Both tools are available free, with no hardware requirement. If you are serious about tracking session growth and turning weekly data into real improvement, Sim2coursecaddie gives you the foundation to do it.
FAQ
How often should golfers compare session data?
Weekly comparisons are the optimal frequency for golfers. They reveal actionable patterns quickly enough to adjust practice focus without the noise of daily snapshots.
What does the ±20% threshold mean in session comparisons?
A week-over-week change greater than ±20% in any key metric signals a non-random shift worth investigating. Changes below that threshold are likely normal variance.
Why does session quality matter more than session count?
Session count is a volume metric that does not reflect skill development. Engagement duration, shot dispersion, and shots per session are stronger indicators of genuine improvement.
How do year-over-year comparisons help golfers avoid mistakes?
Year-over-year data adjusts for seasonal patterns like holiday breaks or weather changes. Without it, a normal seasonal dip can look like a performance problem.
What is a 4-week rolling average and why should golfers use it?
A 4-week rolling average smooths out single-session volatility and shows the underlying trend in your performance. It prevents overreacting to one unusually good or bad week.