
Golf data analysis best practices are defined as focused, evidence-based metric tracking methods that connect specific swing causes to measurable performance outcomes. The industry term for this approach is performance analytics, and it applies equally to on-course play and indoor simulator sessions. Serious golfers who track the right metrics, rather than every available data point, improve faster and more consistently. Tools like launch monitors, 3D motion capture systems, and Sim2coursecaddie give you the raw material. What you do with that data determines whether you actually get better.
1. Golf data analysis best practices: start with a specific question
The single most effective habit in golf analytics is starting every session with one clear question. Experts emphasize focusing analysis on questions like "why am I missing left?" rather than collecting all available metrics and hoping patterns emerge. That distinction matters because unfocused data collection produces noise, not insight. When you define the question first, every metric you gather either answers it or gets set aside.
This approach also makes your practice time more efficient. A session built around "am I losing distance from poor contact?" will look at smash factor and carry distance. A session built around "why does my ball curve right?" will examine face angle and swing path. The question shapes the data you need.

2. Choose 2-3 core metrics per session
Data overload is the most common reason golfers plateau despite using technology. Coach Darren from Zen Golf Studio recommends focusing on 2–3 metrics like face-to-path relationship or smash factor per practice session to avoid analysis paralysis. Tracking 12 metrics at once splits your attention and makes it nearly impossible to identify what actually changed.
The most actionable core metrics for most golfers include:
- Smash factor: ball speed divided by clubhead speed; measures contact efficiency
- Launch angle: affects carry distance and trajectory
- Spin rate: controls ball flight shape and stopping distance
- Face angle at impact: the primary driver of initial ball direction
- Carry distance: the real-world outcome of all the above
- Swing path: influences shot shape and curve direction
Pick two or three from this list based on your current goal, not your curiosity.
Pro Tip: Set one measurable target for each metric before the session starts. "I want my smash factor above 1.45 on 8 out of 10 drives" is a goal. "I'll look at my smash factor" is not.
3. Understand ball data versus club data
Ball data and club data are not the same thing, and confusing them is a foundational mistake. Ball data represents outcomes like carry distance, spin rate, and launch angle. Club data reveals causes, including club path, face angle at impact, and attack angle. Analyzing ball data alone tells you what went wrong. Club data tells you why.
The correct diagnostic sequence is to identify a pattern in your ball data first, then check the corresponding club data metric. If your carry distance is consistently low, check smash factor before assuming you need more swing speed. If your ball curves right, check face angle before blaming your grip. This cause-and-effect framework prevents you from fixing the wrong thing.
Pro Tip: Always use session averages, not individual shots, when drawing conclusions. One outlier shot can look like a trend if you only hit five balls. Hit at least 8 before reading anything into the numbers.
4. Build a consistent data collection protocol
Reliable data requires consistent conditions. A meaningful baseline requires 8–12 shots per club under the same setup, tempo, and environment. Changing your stance, ball position, or warm-up routine mid-session contaminates the data and makes comparisons unreliable.
A practical collection workflow looks like this:
- Define the objective before hitting a single ball
- Warm up separately from your data collection block
- Hit 8–12 shots per club with consistent setup and intent
- Record session averages, not just peak or worst shots
- Log conditions including simulator settings, date, and any equipment changes
This structure turns a practice session into a repeatable experiment. When you change something in your swing, you can compare the new data against your baseline with confidence.
Pro Tip: Use session trend charts to visualize progress across weeks, not just within a single session. Single-session data tells you where you are. Multi-session trends tell you whether you are actually improving.
5. Use the small sample validation method
Most golfers wait too long to find out if a swing change is working. The small sample validation method recommends testing swing changes with 15–20 shot mini-sessions to verify improvement trends before committing to full rounds. This shortens the feedback loop dramatically and prevents you from grooving a change that is not actually helping.
The method works in three steps. First, establish your baseline average for the target metric. Second, make one specific change and hit 15–20 balls. Third, compare the new average to the baseline. If the metric moved in the right direction consistently, the change is worth keeping. If it did not, you have lost 20 minutes, not three weeks of practice.
6. Avoid the most common data analysis mistakes
Poor data habits produce misleading conclusions. Zen Golf Studio warns that too many charts and poor-quality readings distract from real progress. The most damaging mistakes are specific and avoidable.
- Overtracking: logging every available metric creates noise that obscures the signal
- Ignoring context: a low carry distance in cold weather is not the same problem as low carry in warm conditions
- Trusting outliers: one great shot or one terrible shot skews averages and leads to wrong conclusions
- Delayed feedback: analyzing data days after a session means you cannot connect numbers to physical sensations
- Generic drills without data ties: doing a drill because it sounds good, rather than because your data identified a specific gap, wastes practice time
"Focusing on key metrics and zeroing out outliers is crucial. Too many charts and poor readings distract from real progress." — Zen Golf Studio
Cross-check your technology for accuracy too. Balancing accuracy with practical constraints is a real consideration when selecting tools. A consumer-grade launch monitor may be "good enough" for tracking trends, even if it is not laboratory-precise.
7. Track multiple clubs to expose real weaknesses
Most golfers focus their data collection on the driver and ignore the rest of the bag. Tracking multiple clubs reveals gapping problems, inconsistency patterns, and clubs that underperform relative to the rest of your set. A golfer might have excellent driver data but a significant distance gap between their 6-iron and 7-iron that costs them strokes every round.
Gapping analysis is one of the highest-value applications of golf data. When you know the actual carry distances for every club in your bag, you make better decisions on the course. You stop guessing whether a 6-iron or 7-iron reaches the green and start choosing based on real numbers.
8. Use visualization to find patterns faster
Raw numbers in a spreadsheet are hard to interpret. Visualization of performance data helps you spot trends, gaps between clubs, and improvement opportunities that are invisible in a list of averages. Shot dispersion maps, trend lines across sessions, and club gapping charts all communicate information faster than tables of numbers.
Two categories of visualization tools serve different needs:
| Feature category | Entry-level apps | Advanced platforms |
|---|---|---|
| Shot dispersion mapping | Basic 2D scatter | 3D driving range view |
| Trend tracking | Single session | Multi-session comparison |
| AI club recommendations | None | Real-time, course-specific |
| Data import | Manual entry | Simulator integration |
Sim2coursecaddie sits in the advanced category and offers 3D visualization, multi-session trend tracking, and AI-driven club recommendations without a subscription fee. That combination is rare at any price point.
Pro Tip: The role of data visualization in golf performance goes beyond aesthetics. A well-designed chart reveals a pattern in 10 seconds that would take 10 minutes to find in raw data.
9. Set goals that connect data to outcomes
The role of goal setting in golf analytics is to give your data a direction. Without a goal, a smash factor of 1.42 is just a number. With a goal of reaching 1.48 within six weeks, it becomes a benchmark you can track, chase, and celebrate. Combining data with feel and intuition prevents analysis paralysis and keeps improvement grounded in real-world performance.
Goals work best when they are metric-specific, time-bound, and tied to a drill or practice change. "Improve smash factor by 0.05 over four weeks by working on centered contact" is a complete goal. It names the metric, the target, the timeline, and the method. That structure makes it possible to evaluate whether your practice is actually working.
Key takeaways
The most effective golf data analysis practice focuses on 2–3 specific metrics per session, uses ball data to identify problems and club data to find their causes, and validates changes with short mini-sessions before committing to them.
| Point | Details |
|---|---|
| Focus on 2–3 metrics per session | Tracking fewer metrics prevents overload and produces clearer, faster improvement signals. |
| Ball data identifies problems; club data finds causes | Always check club data after spotting a ball data pattern to diagnose the root issue. |
| Use 8–12 shots for reliable baselines | Smaller samples produce misleading averages; consistent protocols produce trustworthy data. |
| Validate changes with 15–20 shot mini-sessions | Short validation blocks shorten feedback loops and prevent grooving ineffective changes. |
| Visualization accelerates pattern recognition | Charts and trend lines reveal insights in seconds that raw numbers hide for minutes. |
What I've learned from years of watching golfers misuse data
Most golfers who invest in launch monitors and analytics apps make the same mistake. They collect everything and act on nothing. I have seen golfers with beautiful spreadsheets full of spin rates, attack angles, and dynamic loft numbers who have not improved their handicap in two years. The data was not the problem. The lack of a question was.
The golfers who improve fastest are the ones who walk into a session with a specific problem to solve. They are not curious about their data in general. They are annoyed about one specific thing, and they use data to fix it. That focus is the difference between data as a hobby and data as a tool.
The other thing I have noticed is that feel and data need to coexist. When a golfer's numbers improve but the swing feels wrong, something is off. When the swing feels right but the numbers do not move, the feel is lying. The best players I have worked with treat data as a second opinion, not a verdict. They use it to confirm what they sense and to challenge what they assume. That combination produces real, lasting improvement.
— Jeff
How Sim2coursecaddie puts these practices to work
Serious golfers need a platform that connects simulator data to real course decisions.
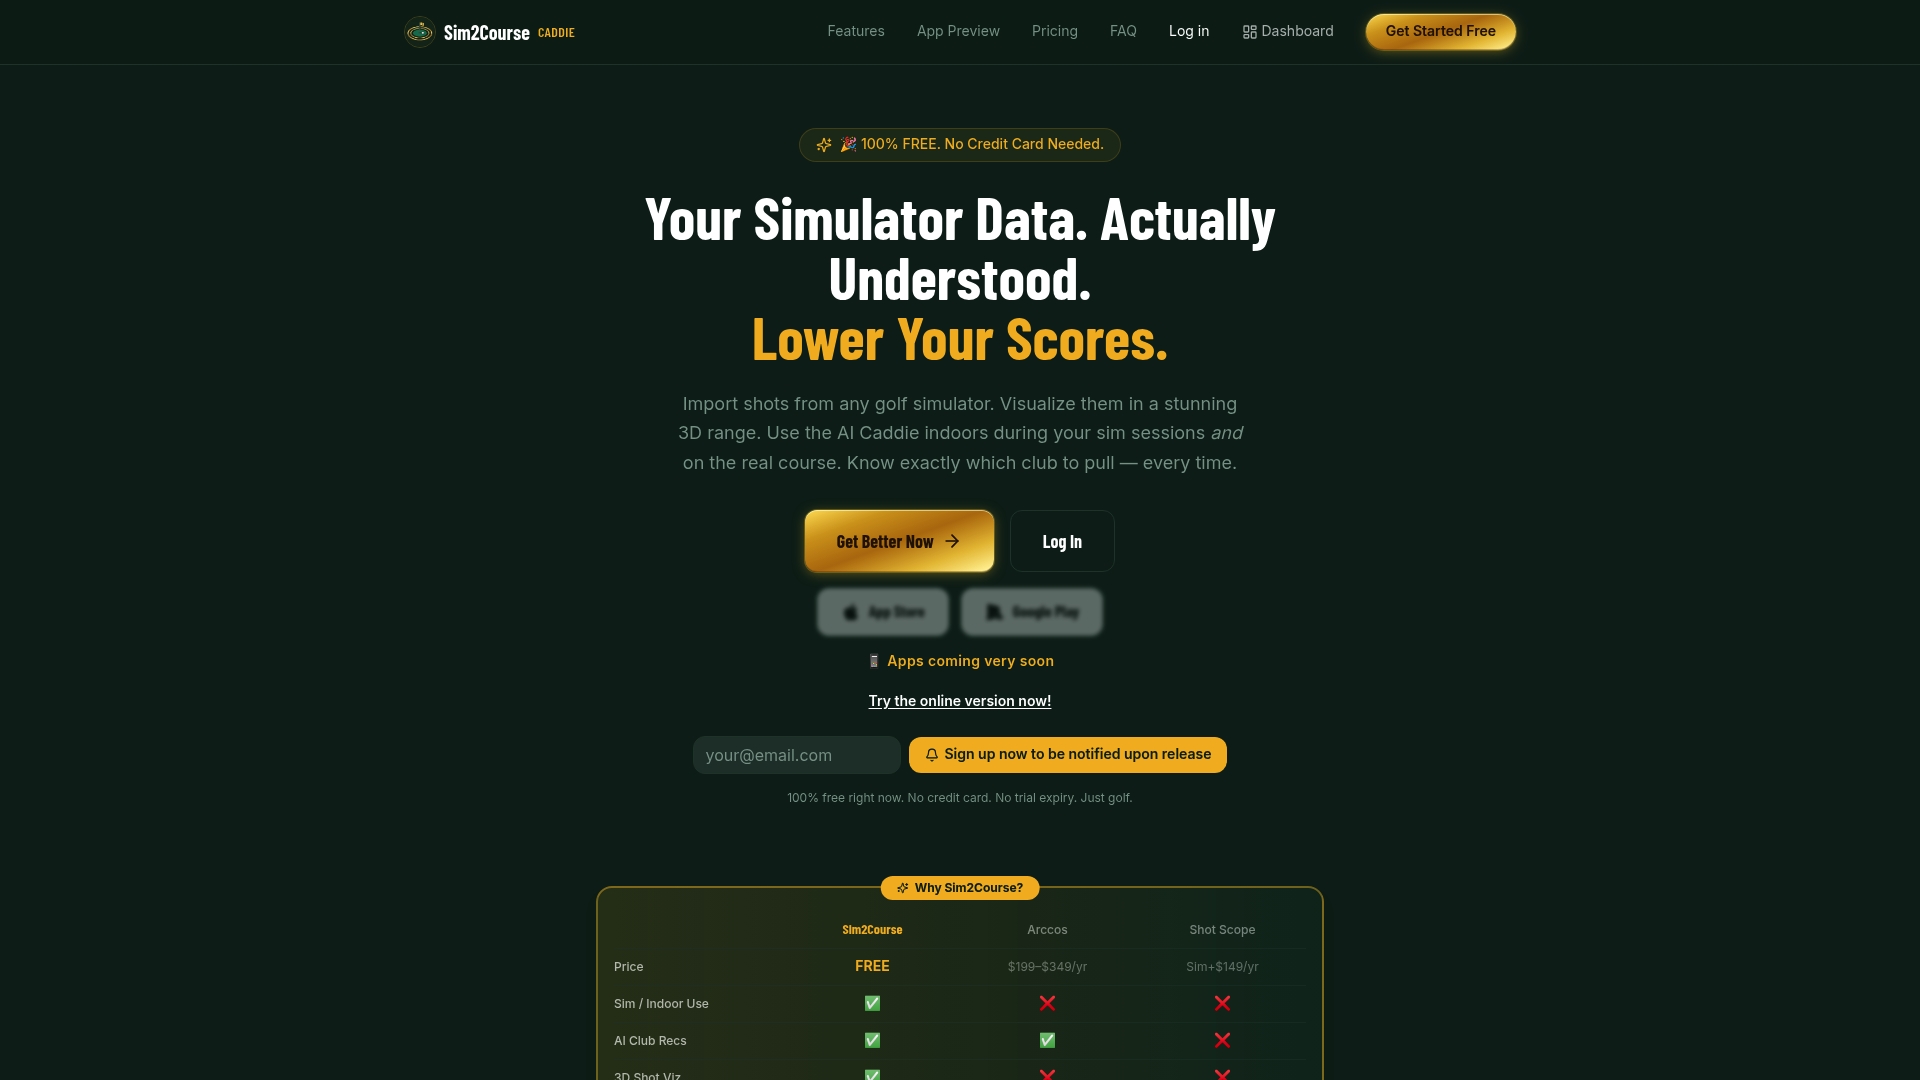
Sim2coursecaddie lets you import shot data from any golf simulator, view your shots in a 3D driving range, and receive AI-driven club recommendations based on your actual performance history. The platform tracks multiple clubs across sessions, visualizes trends over time, and surfaces the patterns that matter most to your game. All of that is available for free, with no hardware lock-in and no subscription required. If you are ready to turn your simulator sessions into on-course performance gains, Sim2coursecaddie gives you the tools to do it.
FAQ
What metrics matter most for golf data analysis?
Smash factor, launch angle, spin rate, carry distance, face angle, and swing path are the most actionable metrics for most golfers. Focus on 2–3 per session based on your current performance goal.
How many shots do I need for reliable golf data?
A reliable baseline requires at least 8–12 shots per club under consistent conditions. Smaller samples produce averages that are too easily skewed by one or two outlier shots.
What is the difference between ball data and club data?
Ball data shows outcomes like carry distance and spin rate. Club data reveals causes like face angle and swing path. Use ball data to identify a problem, then use club data to find its root cause.
How do I know if a swing change is actually working?
The small sample validation method recommends testing changes with 15–20 shots and comparing the new average to your baseline. If the target metric improves consistently, the change is worth keeping.
What is the biggest mistake in golf data analysis?
Overtracking is the most common and damaging mistake. Zen Golf Studio identifies collecting too many metrics and tolerating poor-quality readings as the primary reasons golfers fail to make progress despite using analytics tools.