
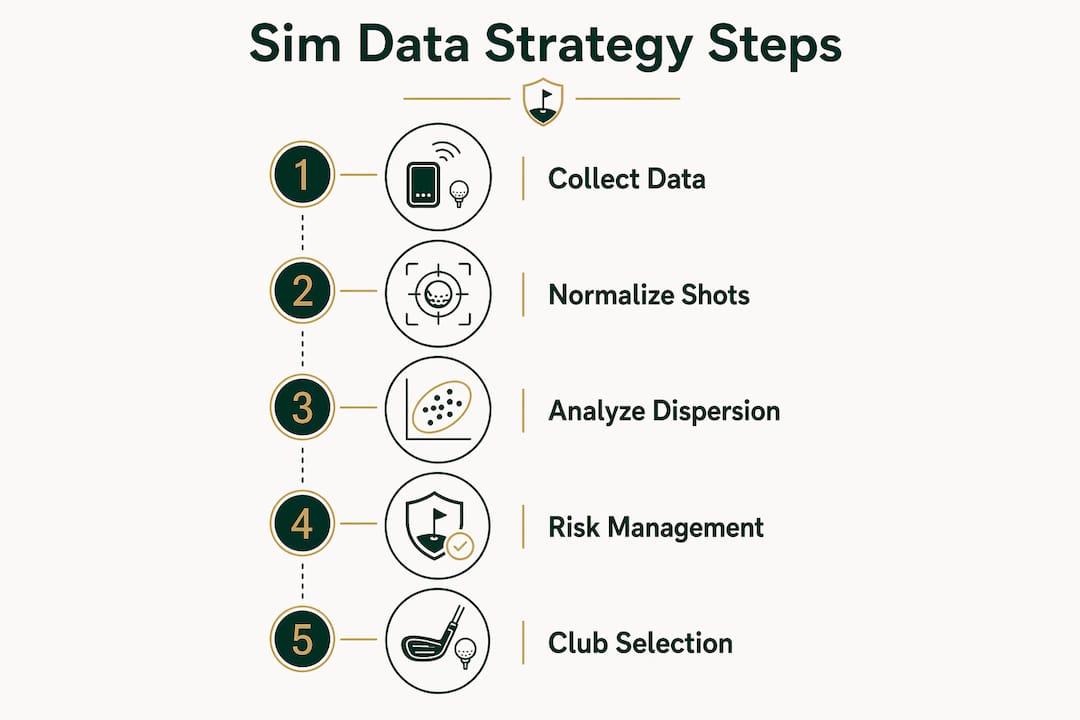
A sim data strategy for tight courses is defined as the systematic collection, normalization, and application of simulator shot metrics to make smarter club and shot decisions on narrow, tree-lined holes. Golfers who rely on raw feel or best-case distances routinely overestimate their carry and underestimate their dispersion. The result is penalty strokes that have nothing to do with swing mechanics. Driving accuracy carries significantly more weight on tight, tree-lined courses than on open venues, a finding confirmed by analysis of over 119,000 professional rounds. That single fact reframes the entire practice session: accuracy data matters more than distance data when the fairway is 28 yards wide. Sim2coursecaddie turns that principle into a repeatable workflow, pulling shot data from any simulator and translating it into course-ready decisions.
What key simulator data points matter most on tight courses?
Carry distance, ball speed, launch angle, club path/face angle, and spin rate are the five data points that form the technical foundation for tight course planning. Each one tells a different part of the story.
- Carry distance is your baseline. It tells you exactly how far the ball travels in the air, which is the number that matters when a bunker or tree line sits at 240 yards.
- Ball speed reflects contact quality. Low ball speed on a given club signals mis-hit tendency, which directly predicts wider dispersion on tight holes.
- Launch angle determines trajectory and, by extension, how much the ball rolls out after landing. On firm, tight fairways, a lower launch can turn a safe carry into a runout hazard.
- Club path and face angle are the two numbers that explain left-right miss patterns. A golfer with a consistent 3-degree out-to-in path knows their miss is left. That knowledge changes aim lines on every tight hole.
- Spin rate affects both distance and curve. High spin amplifies any face angle error, turning a slight fade into a hard slice on a narrow corridor.
Tight courses punish dispersion more than they punish distance loss. A golfer who hits 230 yards with a 15-yard left-right spread is in more trouble than one who hits 210 yards with a 10-yard spread. The data makes that tradeoff visible.
Pro Tip: Track club path and face angle together, not separately. The gap between them is what actually curves the ball. A 2-degree face-to-path gap at impact is manageable on an open course and dangerous on a tight one.

How to collect and normalize sim data for tight course prep
Raw simulator numbers are only useful when they reflect your real swing, not your best swing. The collection process matters as much as the data itself.
- Set up consistent sessions. Warm up fully before recording any data. Cold swings produce shorter, less reliable carry numbers that skew your averages downward.
- Hit at least 20 shots per club. Recording a minimum of 20 shots per club and then excluding the best and worst three shots removes outliers and prevents you from building a strategy around rare perfect contact.
- Exclude the top three and bottom three results. This step is non-negotiable. Your best three shots will never represent what happens on the 14th tee when you are one over and the trees are closing in.
- Build a three-number system per club. Modeling three carry distances per club, specifically your minimum, average, and comfortable maximum, gives you a risk-adjusted range rather than a single number. On a tight hole, you play the minimum, not the average.
- Track dispersion width per club. Measure the left-right spread of your middle 14 shots. Record this number alongside your carry data. A club with a 12-yard dispersion width needs 6 yards of margin on each side of your aim point to keep the ball in play.
- Update your charts every 6–8 weeks. Seasonal changes, swing adjustments, and fitness shifts all affect carry and dispersion. Stale data produces bad decisions.
Linking your shot-by-shot data logs to a structured review process turns individual sessions into a growing performance record. That record is what separates a golfer who practices from one who prepares.
Pro Tip: Run your data collection session at the same time of day you typically play. Fatigue levels and warm-up routines vary by time of day, and those differences show up in your carry numbers.
How to apply sim data to risk-managed club selection on tight holes
The goal on a tight hole is not to hit the longest club you can carry. The goal is to put the ball in a position where your next shot is playable. Playing smarter by choosing safer clubs and aiming for safer parts of the fairway increases your probability of a two-putt par without requiring any swing change.
Your dispersion data makes this concrete. Here is how to apply it hole by hole:
- Match club dispersion to fairway width. If a fairway is 30 yards wide and your driver has a 22-yard dispersion, you have 4 yards of margin on each side. Your 3-wood with a 14-yard dispersion gives you 8 yards of margin. That extra margin is the difference between a fairway and a lateral hazard.
- Identify your safe miss direction. Advanced risk management means identifying which side of the hole is recoverable and adjusting your aim line so that even a mis-hit stays out of penalty territory. Your club path data tells you which direction your miss goes. Aim away from the side where your miss pattern points.
- Plan the shot before the shot. Effective course management requires thinking about where your next shot will come from, not just where this shot lands. A 220-yard drive in the center of the fairway beats a 260-yard drive in the rough every time when the approach requires a precise yardage.
- Use your minimum carry number on forced carries. Never use your average carry over water or trees. Use your minimum. If the minimum does not clear the hazard, take a shorter club that does.
- Know when to be aggressive. Tighter dispersion clubs like 3-wood can outperform the driver on tight holes not because they go farther, but because their shot group is narrower. When the data shows a club with both adequate distance and tight dispersion, that is the aggressive play.
Understanding how personal shot data informs club choice is the single biggest shift a simulator golfer can make. Distance ego is the most expensive habit in golf.
How to troubleshoot your sim data strategy for consistent improvement
Even a well-built data system breaks down when golfers fall into predictable traps. Recognizing these mistakes early saves strokes.
- Stop using peak distances. The most common error is pulling the longest carry from a session and treating it as your number. Simulator sessions fail when golfers rely on best-shot distances rather than normalized averages. Your peak carry happens maybe once every 20 swings. Plan around your average.
- Never skip dispersion tracking. Golfers who track only carry distance miss half the picture. Dispersion data is what tells you which club is actually safe on a given hole. Tracking multiple clubs reveals performance variability that a single-club focus will never expose.
- Update your data on a schedule. Set a calendar reminder every 6–8 weeks to run a fresh data collection session. Swing changes, new equipment, and seasonal fitness shifts all change your numbers. Outdated charts lead to outdated decisions.
- Use visualization tools to find patterns. A shot-by-shot review in a golf performance dashboard exposes miss tendencies that raw numbers hide. When you see 14 of 17 shots clustering left of center, you have a directional bias that changes your aim strategy on every tight hole.
- Test risk-reward scenarios in the simulator. Set up repeated carries over virtual hazards and track your success rate. Simulation experts recommend systematically testing these scenarios to determine empirically which club and carry combination gives you the best odds.
"Success in simulation-based planning hinges on integrating high-quality, relevant data and validating models effectively, rather than just accumulating more data." Leading companies confirm that data quality beats data volume every time. The same principle applies directly to your sim sessions: 20 well-recorded shots beat 100 careless ones.
The golfer who reviews their data after every session improves faster than the one who only practices. Reflection is the step most golfers skip.
Key takeaways
A sim data strategy for tight courses works because it replaces distance ego with dispersion awareness, turning simulator sessions into a repeatable decision-making system.
| Point | Details |
|---|---|
| Five core data points | Carry distance, ball speed, launch angle, club path/face angle, and spin rate form the foundation of tight course planning. |
| Normalize with 20+ shots | Record at least 20 shots per club, then exclude the top and bottom three to build a realistic carry baseline. |
| Three-number club system | Track minimum, average, and maximum carry per club to make risk-adjusted decisions on narrow holes. |
| Dispersion beats distance | Choose clubs with tighter shot groups over clubs with longer but wider dispersion on tight fairways. |
| Update data regularly | Refresh your charts every 6–8 weeks to keep club selection aligned with your current swing. |
What I have learned from building sim data systems for tight courses
The three-number club system changed how I think about every tee shot on a tight hole. Before I built it, I was playing to my best carry. After I built it, I started playing to my minimum. That single shift dropped more strokes than any swing change I have ever made.
The mental adjustment is harder than the data work. Golfers are conditioned to reach for the longest club that can theoretically make the carry. The data shows that "theoretically" is the problem. Your minimum carry is what you can count on when the pressure is real and the warm-up was short.
I have also found that dispersion data is the most underused number in amateur golf. Every golfer I know tracks distance. Almost none of them track left-right spread. When you see your 3-wood has a 12-yard dispersion and your driver has a 22-yard dispersion, the club choice on a 28-yard-wide fairway becomes obvious. The data removes the argument.
The last thing I will say is this: update your charts. Stale data is worse than no data because it gives you false confidence. I run a fresh session every six weeks, and my numbers shift more than I expect every single time.
— Jeff
How Sim2coursecaddie puts your data to work on tight courses
Sim2coursecaddie is built for exactly this kind of work. It imports shot data from any golf simulator, so you are not locked into one hardware ecosystem.
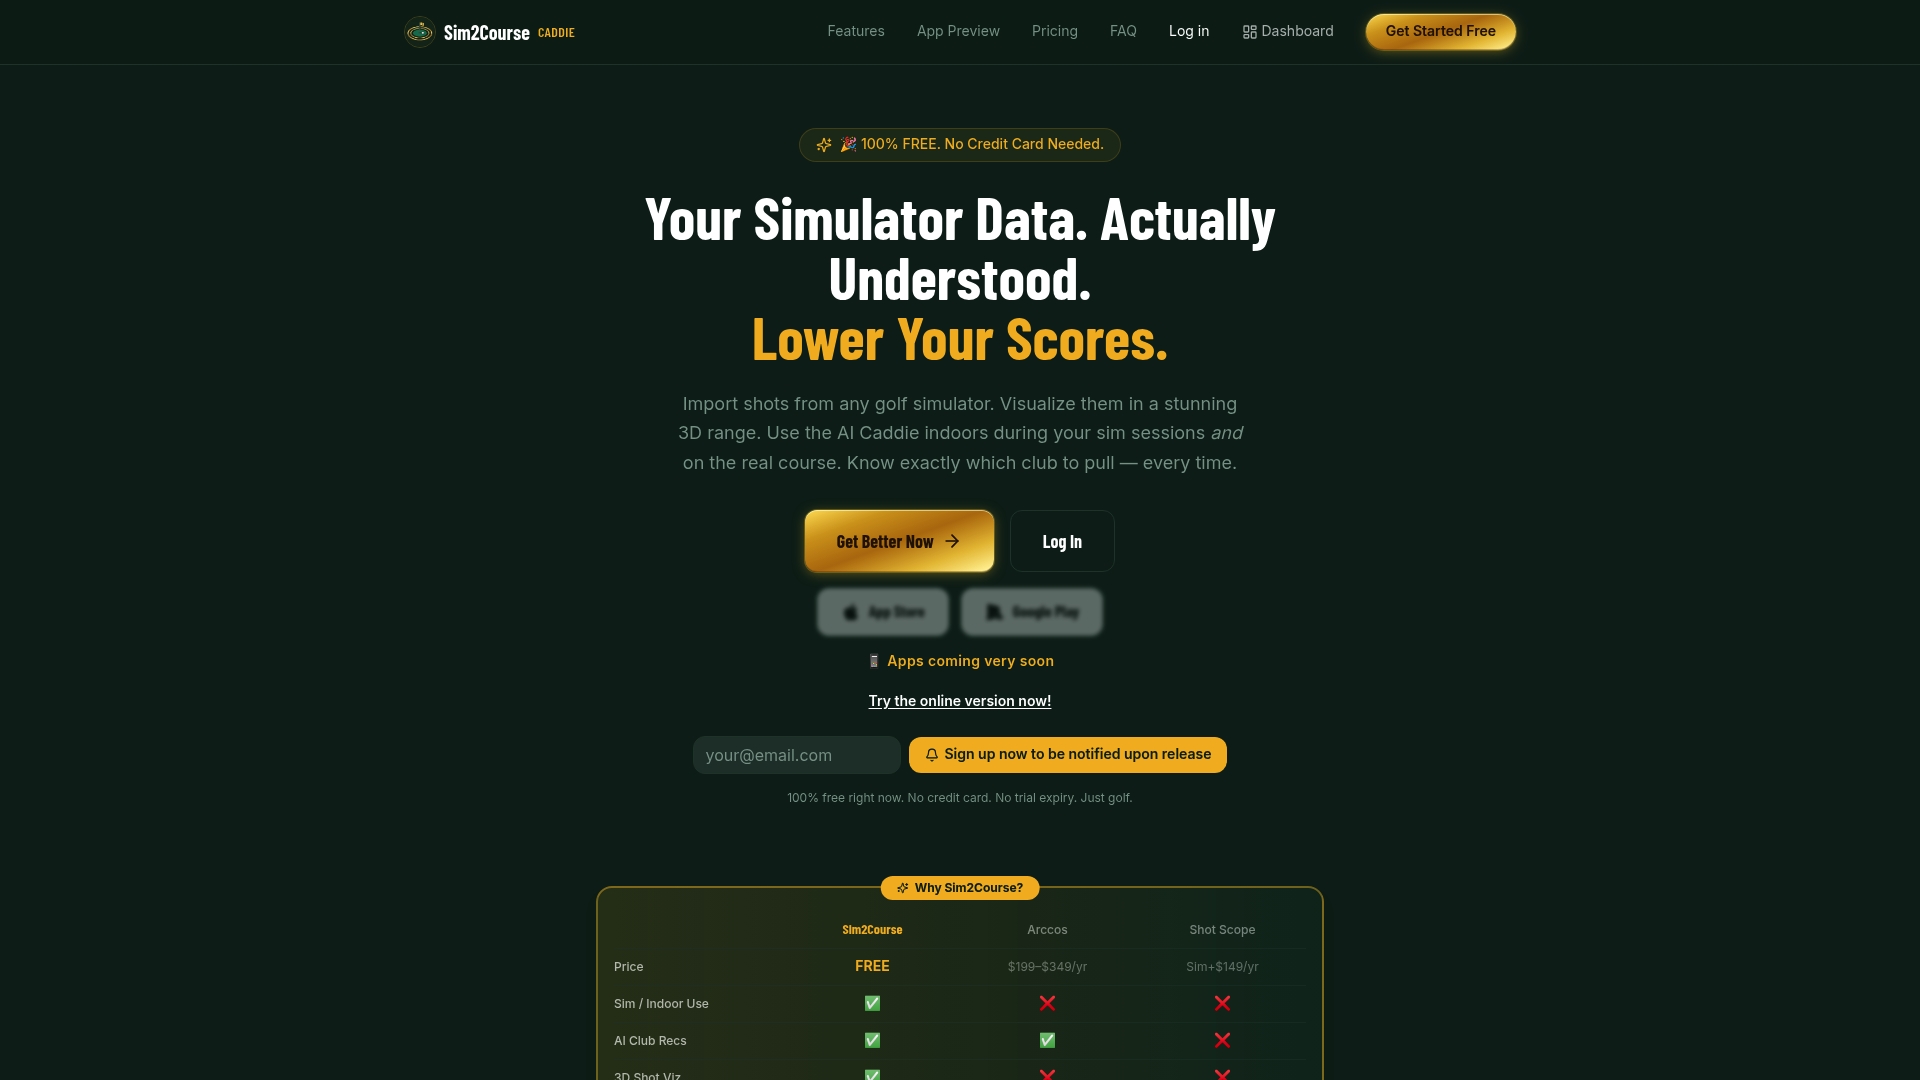
The app's AI-driven club recommendations factor in your actual carry and dispersion profiles, not generic yardage charts. You can visualize your shot groups in a 3D driving range view, which makes dispersion patterns immediately visible rather than buried in a spreadsheet. Sim2coursecaddie offers all of this at no cost, which means you can automate your performance tracking without a subscription standing between you and your data. When you are ready to build a full system around your tight course prep, start with Sim2coursecaddie and let your own shot data do the work.
FAQ
What is a sim data strategy for tight courses?
A sim data strategy for tight courses is the process of collecting, normalizing, and applying simulator shot metrics, specifically carry distance and dispersion, to make safer club and shot decisions on narrow fairways. The goal is to replace feel-based guessing with data-backed choices that keep the ball in play.
How many shots should I record per club in the simulator?
Record at least 20 shots per club, then remove the top three and bottom three results before calculating your averages. This method eliminates outliers and prevents you from building a strategy around rare perfect contact.
Why does dispersion matter more than distance on tight holes?
Dispersion measures your left-right spread, which determines whether your ball stays in the fairway on a narrow hole. A club with a 10-yard dispersion on a 28-yard fairway gives you 9 yards of margin on each side, while a longer club with a 22-yard dispersion leaves only 3 yards.
How often should I update my simulator data charts?
Update your carry and dispersion charts every 6–8 weeks. Swing changes, new equipment, and seasonal fitness shifts all affect your numbers, and outdated data leads to poor club selection on the course.
Can sim data strategy lower scores without changing my swing?
Yes. Choosing safer clubs, adjusting aim lines based on miss tendencies, and playing to your minimum carry rather than your peak carry all lower scores without requiring any mechanical swing change.