
A data-backed layup strategy is the use of golf simulator analytics and quantitative performance data to decide when to lay up, where to land the ball, and which club gives you the best position for your next shot. It replaces gut feel with actual numbers from your own game. The result is fewer penalty strokes, more predictable scoring, and a round that reflects your real skill level rather than a series of avoidable mistakes.
The core elements of a data-backed layup strategy include:
- Carry distance data from simulator sessions mapped to each club in your bag
- Shot dispersion patterns showing your miss tendencies under pressure
- Strokes gained metrics that quantify the cost of each decision, not just the outcome
- Hazard penalty modeling to calculate the true scoring risk of aggressive plays
- Position play targets that set up your highest-percentage approach distances
1. Core principles that drive sound layup decisions
Effective course management strategy starts with one idea: your layup is not a retreat. It is an offensive move to a specific yardage where you score best.
Risk assessment before every layup. Before you pull a club, you need to know the actual cost of the alternative. Strokes gained data makes this concrete. A 10-handicap golfer needs 2.77 strokes to hole out from 90 yards on the fairway. From a bunker in that same zone, that number climbs to 3.24 strokes. Nearly half a shot lost, before you even factor in the mental toll of a difficult recovery.
Position play over distance. The goal of a layup is not to get as close as possible. It is to land in the zone where your scoring average is lowest. For most golfers, that means a full-swing yardage with a known club, not a tricky partial from 40 yards.
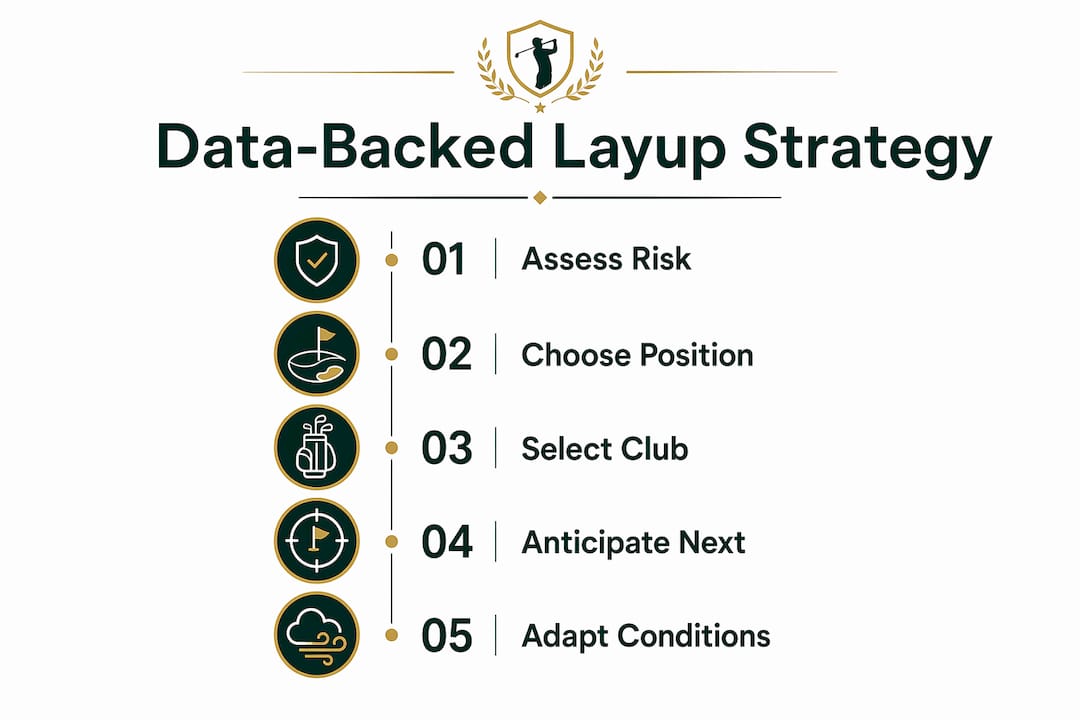
Shot shaping and club selection. Your layup club should match your most reliable shot shape, not your most ambitious one. If your 7-iron draws reliably and your 5-iron leaks right under pressure, that data should drive the decision.
Anticipating the next shot. Every layup sets up an approach. Think two shots ahead: what yardage do you want for your approach, and which side of the fairway gives you the best angle to the pin?
Adapting to conditions. Wind, firm turf, and elevation changes all shift your effective carry distances. A data-driven approach accounts for these variables rather than relying on flat-yardage assumptions.
2. How to use simulator analytics to sharpen your layup game
Practice data becomes course strategy when you know how to read it. The steps below turn raw simulator numbers into real decisions on the course.
- Collect carry distances for every club, not just your best swings. Your average carry under normal conditions is more useful than your maximum.
- Map your dispersion patterns. Know whether you miss left or right with each club, and by how much. A 15-yard left miss on a layup toward a left-side bunker is a critical data point.
- Identify your high-percentage yardage zones. Most golfers score significantly better from a full-swing distance than from awkward partial yardages. Your simulator data will show you exactly where those zones are.
- Model hazard penalties. Use strokes gained benchmarks to assign a real scoring cost to bunkers, water, and rough in your layup corridor.
- Integrate course conditions. Adjust your target yardages for wind and firmness before each round, not mid-hole.
Pro Tip: The 60–90 yard bunker zone is the most costly area on most par 4s and par 5s. When planning a layup, calculate whether your intended landing zone puts you at risk of finishing in that corridor. If it does, take more club and fly it past the danger.
AI-driven tools like Sim2coursecaddie take this further by analyzing simulator shot data and generating personalized club recommendations tied to real-time course conditions. Rather than applying generic yardage charts, you get recommendations built from your actual carry distances and miss patterns.

Integrating diverse data sources, including shot data, course conditions, and historical performance, consistently improves decision-making in dynamic environments, as multi-modal data frameworks in performance analysis confirm.
3. Common mistakes that inflate your score on layup holes
Most layup errors are not physical. They are decision errors, and they show up clearly in the data.
- Ignoring your actual carry distances. Golfers routinely overestimate how far they carry the ball. If your simulator data says your 6-iron carries 165 yards on average, plan for that number, not the 175 you hit once last summer.
- Underestimating the 60–90 yard bunker penalty. As the strokes gained data shows, a bunker in the layup zone costs more than a bunker beside the green for most amateur golfers. Treating these hazards as minor is a consistent scoring mistake.
- Choosing the wrong target side. Landing on the wrong side of the fairway can add a full club of difficulty to your approach. Your layup target should account for pin position and approach angle, not just distance.
- Making reactive decisions under pressure. Overconfidence after a good drive or frustration after a bad one leads to layup targets chosen emotionally rather than analytically. A pre-round plan built on your data removes this variable.
- Using partial swings when a full swing is available. Partial swings produce wider dispersion. If you can take one more club and make a full, controlled swing to a slightly farther target, the data almost always supports that choice.
4. Applying these strategies to lower your scores round by round
Turning analytics into lower scores requires consistent tracking and honest review after each round.
- Build a pre-round layup plan for every par 4 and par 5 on the course. Identify your target landing zones before you tee off, using your carry data and the course's hazard map.
- Track layup outcomes separately from your overall stats. Note whether you hit your intended zone, and record the approach distance that resulted.
- Monitor strokes gained around the green over time. If your layup execution is improving but your scoring is not, the problem may be in your short game, not your strategy.
- Review bunker avoidance rates. A rising bunker avoidance percentage in layup zones is one of the clearest signals that your data-driven approach is working.
- Adjust your target zones seasonally. Firm summer conditions extend carry distances; wet fall conditions shorten them. Update your carry data after every significant weather shift.
Connecting performance metrics to your decisions over time is what separates golfers who improve steadily from those who plateau. The data only works if you act on it consistently.
5. A realistic timeline for going data-driven
Most golfers can build a functional data-driven layup system in about eight weeks.
Weeks 1–2: Run three to five simulator sessions focused on carry distance verification. Record average carry for every club, not just full swings. Note your typical miss direction.
Weeks 3–4: Map your dispersion data onto the layouts of your two or three most-played courses. Identify the layup zones where your miss tendencies create the most risk.
Weeks 5–6: Play two rounds using a written pre-round layup plan. Track whether you hit your target zones and what approach distances resulted.
Weeks 7–8: Review your tracked data. Adjust target zones based on what the numbers show, not what felt right. By this point, most golfers have a clear picture of their two or three highest-value layup adjustments.
6. Real-world examples of data-backed layup strategy in action
The clearest illustration of this approach comes from analyzing a 420-yard par 4 similar to holes featured at the Zurich Classic. Using strokes gained data on that hole type, the most dangerous bunker is not the one guarding the green. It sits in the 60–90 yard layup corridor. A golfer who lays up short of that bunker, even at a longer approach distance, scores better on average than one who fires at the green and catches the sand.
A second example: a golfer with a reliable 8-iron carry of 145 yards and a tendency to miss right under pressure. On a hole with water right at 130 yards, the data says to take a 7-iron to 155 yards, left-center, even though that leaves a longer approach. The dispersion data makes the right call obvious once you look at it.
Data visualization tools make these patterns visible in ways that raw numbers alone cannot. Seeing your shot dispersion plotted against a hole layout changes how you think about risk.
7. Metrics that tell you whether your layup strategy is working
Track these numbers over a minimum of ten rounds before drawing conclusions.
| Metric | What it tells you |
|---|---|
| Layup zone hit rate | Percentage of layup shots that land in your planned target zone |
| Bunker avoidance in layup corridor | How often you stay out of the 60–90 yard danger zone |
| Average approach distance after layup | Whether your layup positions are actually improving your approach angles |
| Strokes gained: approach | Whether better layup positioning is translating to better approach performance |
| Scoring average on par 5s | The clearest summary metric for layup strategy effectiveness |
Tracking session trends over time is what converts isolated good rounds into a reliable pattern. One good week proves nothing. Ten rounds of improving layup zone hit rates proves the system is working.
Sim2coursecaddie puts your layup data to work immediately
If you've been making layup decisions based on feel, your real carry distances are probably the first thing worth checking. Sim2coursecaddie imports your simulator shot data, maps it against actual course conditions, and delivers AI-driven club recommendations built from your numbers, not generic yardage charts.

There's no hardware requirement and no subscription fee. You get carry distance verification, shot dispersion analysis, and personalized layup recommendations the moment you connect your simulator data. For golfers serious about 3D range analytics and smarter course management, it's a direct path from practice data to lower scores.
Key Takeaways
A data-backed layup strategy built on your actual carry distances and strokes gained metrics consistently reduces scoring risk and improves round-to-round consistency.
| Point | Details |
|---|---|
| The 60–90 yard bunker penalty | A bunker in the layup zone costs a 10-handicap golfer nearly half a stroke compared to the fairway at the same distance. |
| Position over distance | The goal of every layup is a full-swing yardage, not the shortest possible approach. |
| Eight-week implementation | A functional data-driven layup system takes roughly eight weeks of simulator sessions and tracked rounds to build. |
| Key metrics to track | Monitor layup zone hit rate, bunker avoidance, and strokes gained on approach over at least ten rounds. |
| Sim2coursecaddie | Imports your simulator data and delivers AI-driven club recommendations tied to real course conditions, free of charge. |