
Why tracking golf progress over time is the fastest path to lower scores
Golfers who regularly track their stats typically see larger handicap improvements compared to those who do not, illustrating the value of data-driven practice. That gap isn't about talent. It's about feedback. Without data, you're practicing on instinct, and instinct is a notoriously unreliable guide to what's actually holding your game back.

The core reason to track golf progress over time is simple: numbers don't lie. After a few rounds of logging stats, your strengths and weaknesses become obvious in ways that feel and memory never reveal. You stop spending most of your practice time on areas that don't need it, and start targeting the shots that are actually costing you strokes.
Here's what consistent tracking delivers:
- Objective feedback on where you're genuinely losing strokes, not where you think you are
- Focused practice built around real weaknesses rather than comfortable habits
- Motivation from watching measurable metrics move in the right direction
- Confidence on the course, because you know your distances and tendencies cold
- A performance gap between your good rounds and bad ones, which tells you exactly what breaks down under pressure
Experts recommend spending a few minutes after each round logging stats. That's the minimum investment for maximum practice clarity.
Table of Contents
- Which metrics actually tell you where your game stands
- How to set up a tracking system you'll actually stick with
- How to read your data and turn trends into better practice
- Common tracking mistakes that stall your improvement
- How Sim2coursecaddie takes your analytics to the next level
- Sim2coursecaddie puts your practice data to work on the course
- Key Takeaways
Which metrics actually tell you where your game stands
Progress in golf isn't just a lower score. It's tighter dispersion, more greens hit from 150 yards, fewer penalty strokes, and a scrambling rate that improves significantly over time. Score is the output. These metrics are the inputs you can actually control and improve.
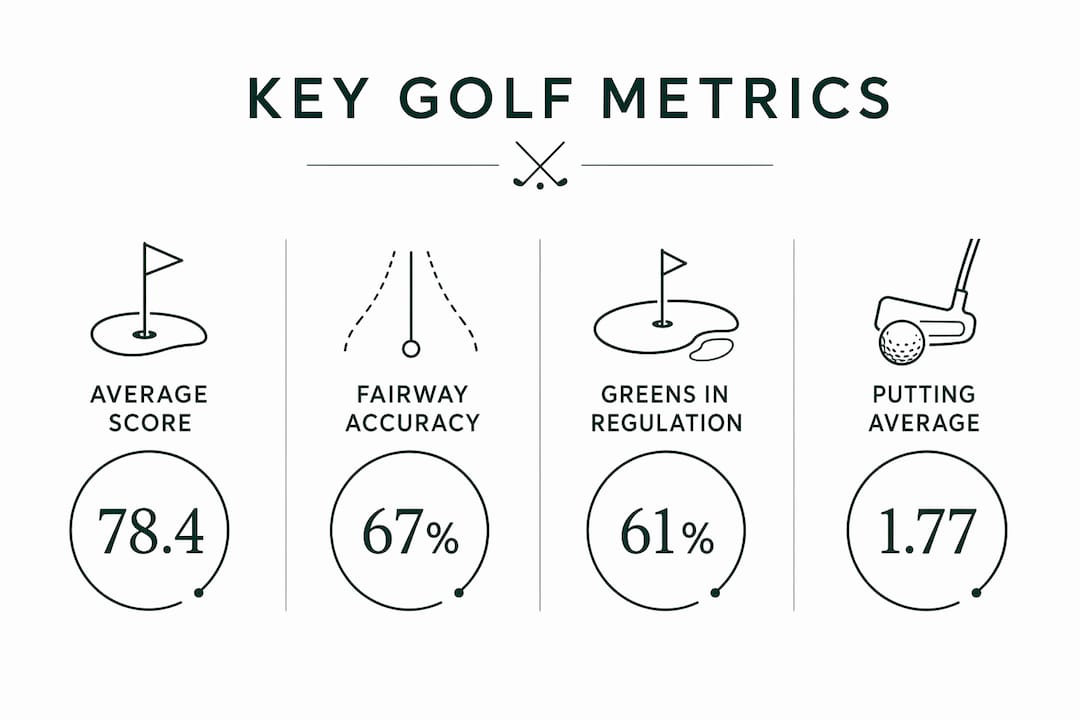
On-course stats to log every round
The five core stats give you a complete picture of how you build a score:
- Fairways Hit: Tracks driving accuracy and reveals directional tendencies over time
- Greens in Regulation (GIR): The single strongest predictor of scoring average at every skill level
- Putts per round: Separates putting problems from approach shot problems
- Scrambling rate: Measures how often you save par after missing a green. A higher scrambling rate signals a stronger short game, even when ball-striking stats look similar
- Penalty strokes: Reveals course management habits and risk decisions that quietly inflate scores
Track which direction you miss fairways and greens, not just whether you miss them. Patterns in your misses are where the real coaching information lives.
Practice session metrics to pair with on-course data
On-course stats tell you what happened. Practice session data tells you why. For simulator or range sessions, focus on:
- Ball speed and carry distance per club, averaged over 10 shots
- Dispersion (how tightly your shots cluster around the target line)
- Smash factor as a measure of strike quality
Combining both data streams gives you the full picture. If your GIR is dropping on par 4s over 400 yards, your carry distance data will tell you whether it's a distance problem or an accuracy problem.
How to set up a tracking system you'll actually stick with
The best tracking system is the one you use consistently. A perfect spreadsheet you abandon after two weeks beats nothing, but a simple notebook you fill in after every session beats both.
Four steps to get started
- Decide what to track. Start with the five on-course stats above plus carry distance and dispersion for practice. Add complexity only when the basic numbers stop telling you what you need to know.
- Choose your tool. A notes app, a spreadsheet, or a dedicated golf stats app all work. The format matters less than the habit.
- Log immediately after the round or session. Memory degrades fast, especially for specific putts and penalty situations. Five minutes in the parking lot is worth more than an hour of reconstruction the next morning.
- Set a weekly review time. Pick a consistent day, even 10 minutes, to compare this week's numbers to last week's. Look for direction, not perfection.
Pro Tip: Track your average carry distance per club over 10-shot samples, not individual shots. One pure strike followed by a toe hit gives you wildly different readings. The 10-shot average is your real number, and watching it climb over weeks is a genuine signal of improving ball striking.
Consistency matters more than completeness. Missing one stat occasionally is fine. Missing entire rounds of data breaks the trend lines you need to spot real improvement. The same principles that make fitness tracking effective apply here: regular, simple logging beats sporadic deep dives every time.

How to read your data and turn trends into better practice
Data without review is just storage. The golfers who actually improve are the ones who look at their numbers weekly and monthly, ask what changed, and adjust their practice accordingly.
A simple trend table to guide your reviews
| Metric | Week 1 | Week 4 | — | What it means |
|---|---|---|---|---|
| 7-iron carry spread (yards) | — | — | — | Consistency improving |
| Scrambling rate | — | — | — | Short game gaining |
| GIR | 4 | 5 | 6 | Approach shots sharpening |
| Putts per round | — | — | — | Lag putting tightening |
| Fairways Hit | 7 | 8 | 9 | Driving accuracy building |
Reviewing data weekly and monthly smooths out the noise from a bad night's sleep or a cold morning. Week-to-week swings are normal. Month-to-month trends are real.
How to act on what you see
- Carry spread tightening is often the first sign of genuine improvement, appearing before average distances increase
- A single outlier club (everything improving except your 5-iron) points to a technique or equipment issue with that specific club
- Scrambling rate stalling while GIR improves means your short game isn't keeping pace with your ball-striking gains
- Putts per round dropping while GIR stays flat means you're getting better at lag putting, not hitting more greens
When a metric plateaus for four consecutive weeks, that's your signal to change the drill, not just practice harder. Tracking session trends over time is what separates deliberate practice from repetitive hitting.
Common tracking mistakes that stall your improvement
Most golfers who try tracking quit within a month. The reasons are predictable, and they're all avoidable.
- Inconsistent logging. Tracking only after good rounds creates a biased dataset. Your bad rounds contain the most useful information about what breaks down under pressure.
- Data overload. Chasing every available metric at once leads to paralysis. Focusing on a few core stats maintains motivation and keeps practice purposeful.
- Ignoring negative trends. A stat that's been declining for three weeks isn't bad luck. It's a pattern that needs attention before it becomes a habit.
- Tracking without reviewing. Logging data and never looking at it is the most common mistake. The value is in the analysis, not the collection.
- Relying on feel instead of data. Most golfers fail to improve because they trust their sense of how they played over what the numbers actually show. Feel is subjective and memory is selective.
- Chasing best shots. Focusing on your longest drive or best iron of the session inflates your sense of where you actually are. Average metrics across 10 shots give you a realistic baseline.
The fix for all of these is the same: keep it simple, stay consistent, and review on a schedule. Three rounds of data tell you almost nothing. Thirty rounds tell you everything.
How Sim2coursecaddie takes your analytics to the next level
Sim2coursecaddie is built specifically for golfers who want to do more with their simulator data than just look at it. The app imports shot data from any golf simulator, then organizes it into a 3D driving range visualization that makes dispersion patterns and carry trends immediately visible across sessions.
Where most tracking stops at raw numbers, Sim2coursecaddie layers in AI-driven club recommendations calibrated to real-time course conditions. That means the carry distance and dispersion data you've built up in practice actually informs which club to pull on a specific hole, in specific weather, at a specific yardage. Practice data becomes course strategy rather than staying locked inside a spreadsheet.
Key capabilities that set it apart:
- Multi-session trend tracking across all clubs, so you can see which clubs are improving and which need work
- 3D shot visualization that makes dispersion patterns obvious at a glance
- AI club recommendations based on your actual performance data, not generic yardage charts
- Drill effectiveness tracking that shows whether a specific practice change is producing measurable results over time
- Session history organization that makes weekly and monthly reviews fast and clear
Pro Tip: Use the 10-Shot Challenge as your session benchmark. Hit 10 shots with your 7-iron and score each one by how close it lands to your carry average and center line. Record that score after every session. A rising trend over weeks is a reliable indicator of genuine technical improvement, regardless of what your scores say on any given day.
Coaches armed with simulator data can diagnose swing problems in a fraction of the time it takes without it. Sim2coursecaddie gives you that same diagnostic clarity without needing a coach in the room, and it does it for free, with no hardware requirement and no subscription.
Sim2coursecaddie puts your practice data to work on the course
Serious golfers who track their progress need more than a place to store numbers. They need a system that connects simulator practice to on-course decisions.

Sim2coursecaddie is that system. Import your shot data from any simulator, watch your carry distances and dispersion patterns take shape across sessions, and get AI-driven club recommendations built from your own performance history rather than someone else's averages. It's free, it works with any simulator hardware, and it's designed for golfers who want their practice to actually count when they step onto the first tee.
If you've been logging stats in a notebook or a basic spreadsheet, Sim2coursecaddie is the next step. The data you're already collecting becomes a live feedback loop between the range and the course. Download Sim2coursecaddie and connect your simulator data to your game today.
Key Takeaways
Regularly keeping playing stats correlates with average handicap improvement of about 3.38 shots versus 1.38 shots for those who do not track, illustrating how data-driven practice replaces guesswork and accelerates improvement.
| Point | Details |
|---|---|
| Track stats after every round | Experts recommend dedicating 5–7 minutes after rounds to logging stats to maximize practice effectiveness and direct practice toward real weaknesses. |
| Focus on five core metrics | Fairways Hit, GIR, Putts, Scrambling, and Penalty Strokes reveal how you actually build your score. |
| Review weekly and monthly | Weekly comparisons catch trends early; monthly reviews confirm genuine improvement over noise. |
| Avoid data overload | Tracking a few key stats consistently beats chasing every available metric and losing focus. |
| Use Sim2coursecaddie | Sim2coursecaddie connects simulator shot data to AI-driven club recommendations, turning practice into course strategy for free. |