
Data benchmarks are defined reference points against which organizations measure performance over time, and setting them is the most direct path to accelerating growth. Without benchmarks, data is just noise. With them, teams know exactly where they stand, what to fix, and how fast they are improving. The importance of data benchmarks shows up in hard results: companies using unified growth analytics environments report a 50% lift in acquisition rates, moving from an 8% to a 12% baseline. That kind of gain does not come from collecting more data. It comes from measuring the right things against a clear standard.
Why setting data benchmarks accelerates growth
A benchmark is a specific, agreed-upon reference point used to evaluate whether performance is improving, declining, or holding steady. The industry term for this practice is performance benchmarking, and it sits at the core of every serious data-driven growth strategy. Without a reference point, a 12% conversion rate means nothing. Against a prior baseline of 8%, it means everything.
Benchmarks create three things teams cannot get from raw data alone:
- Direction. A benchmark tells you whether a metric is moving in the right direction relative to a prior state or target.
- Accountability. Teams with defined performance metrics own their numbers. Vague goals produce vague effort.
- Speed. When a benchmark flags a drop in performance, teams respond immediately rather than waiting for a quarterly review to surface the problem.
The impact of data benchmarks compounds over time. Each improvement becomes the new baseline, and the next improvement is measured against that. This is how organizations build momentum rather than just tracking activity.
Pro Tip: Start with three to five core metrics that directly reflect business outcomes, not activity metrics like page views or emails sent. Benchmark those first before adding complexity.
Why is continuous benchmarking more effective than periodic benchmarking?
Most organizations benchmark on a schedule: quarterly business reviews, annual planning cycles, monthly reports. That approach catches problems after they have already cost money. High-performing organizations treat benchmarking as a continuous capability, not a calendar event. The difference in outcomes is significant.

Growth teams that embed benchmarking into daily and weekly operations cut insight cycles from months to weeks. Shorter insight cycles mean faster experiments, faster corrections, and faster wins. A team that identifies a conversion drop in week two can test a fix in week three. A team running quarterly reviews finds the same drop in month four, after the damage is done.
Here is how leading growth teams operationalize continuous benchmarking:
- Set a weekly review cadence. Assign one person to own the benchmark dashboard and flag deviations above a defined threshold each week.
- Define deviation triggers. Decide in advance what percentage change in a key metric requires an immediate response versus a watch-and-wait approach.
- Log every experiment against the benchmark. Each test result becomes part of the historical record, making the baseline richer and more reliable over time.
- Automate alerts for critical metrics. Manual review misses things. Automated alerts tied to benchmark thresholds catch drops the moment they happen.
- Review the benchmark itself quarterly. As the business evolves, the right reference points change. A benchmark that made sense at $1M in revenue may be irrelevant at $10M.
Continuous benchmarking also prevents operational inefficiencies from scaling into financial losses. A small drop in retention that goes unnoticed for a quarter can represent a significant revenue gap by the time it surfaces in an annual review. Catching it in week two costs almost nothing to fix.
What are best practices for setting effective data benchmarks?
The most common benchmarking mistake is measuring the wrong things with great precision. Before selecting metrics, leaders need to answer one question: does this number directly reflect a business outcome we care about? If the answer is no, the metric does not belong in the benchmark set.
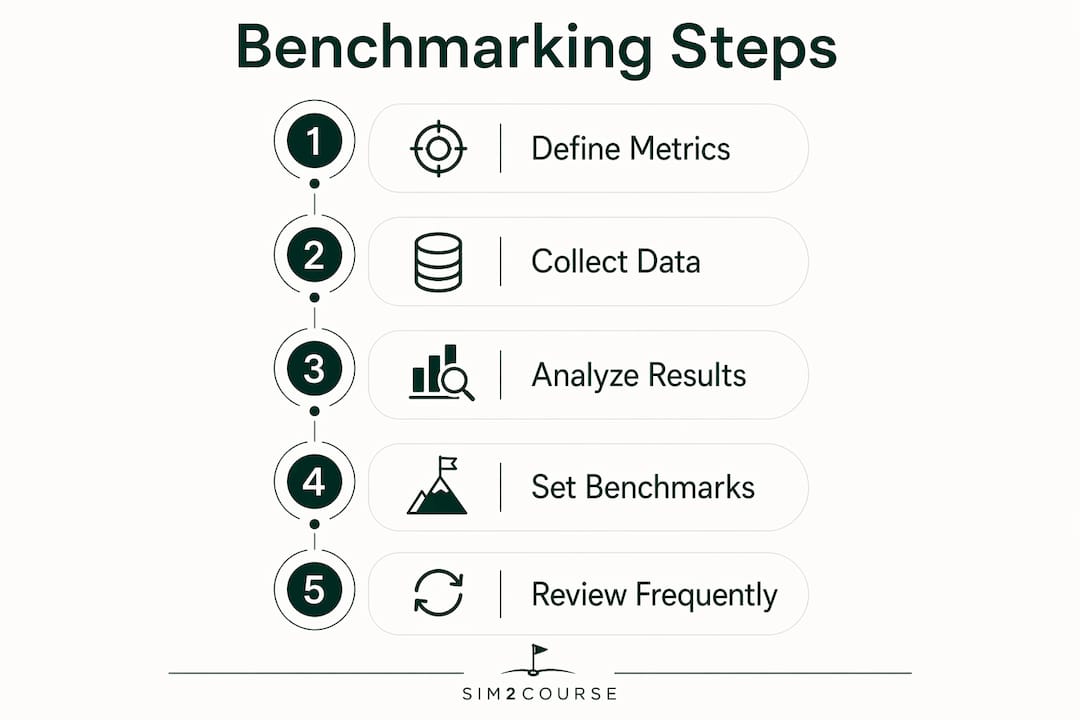
Reliable benchmarking requires rigorous governance, standardized definitions, and human validation. That means every team member uses the same definition of "conversion," "active user," or "qualified lead." Inconsistent definitions produce inconsistent data, and inconsistent data produces benchmarks that mislead rather than guide.
Practical criteria for selecting meaningful benchmarks:
- Stage-appropriate metrics. Early-stage teams should track simple indicators like weekly active users or revenue per customer. Complex attribution models come later.
- Clean data first. Building complex measurement infrastructure too early wastes resources before the business model proves consistent. Start simple.
- Alignment with strategic priorities. If the company's top goal is retention, the primary benchmark should be churn rate, not acquisition volume.
- Frequency of measurement. A metric you can only measure monthly is a weak benchmark. Prefer metrics with weekly or daily data availability.
Consistent, frequent measurement is what turns data points into signals. A single week's conversion rate is a data point. Twelve consecutive weeks of conversion rate data is a signal you can act on with confidence.
Pro Tip: Leadership clarity is the single biggest driver of benchmarking success. When executives disagree on which metrics matter, teams split their attention and no benchmark gets the focus it needs to produce results.
How do data benchmarks directly drive measurable growth outcomes?
The business case for performance benchmarking is not theoretical. Organizations that embed benchmarking into their growth operations see results across multiple dimensions simultaneously.
"Benchmarking enables cost optimization, accelerated transformation, and competitive advantage. Organizations embedding benchmarking see measurable improvements across performance and decision-making domains." — The Hackett Group
The table below maps specific benchmarking practices to the growth outcomes they produce:
| Benchmarking practice | Growth outcome |
|---|---|
| Tracking cohort quality signals | Up to 50% lift in acquisition rates |
| Weekly KPI cadence | Insight cycles reduced from months to weeks |
| Internal baseline improvement focus | Compounding gains in conversion and retention |
| Standardized metric definitions | Reliable signals that reduce decision errors |
| Stage-appropriate measurement | Faster iteration without infrastructure waste |
Internal benchmarks focused on improving historical baselines produce faster compounded growth than chasing external industry standards. The reason is simple: external benchmarks reflect someone else's business model, customer base, and market conditions. Your internal baseline reflects your reality. Beating your own prior performance, consistently and measurably, is how organizations build durable competitive advantage.
Benchmarks also make progress legible and hold teams accountable, which is essential for validating whether experiments are actually working. Without a clear reference point, a team can run ten experiments and never know which one moved the needle. With benchmarks, every result is interpretable and every win is repeatable.
The compound effect is the most underappreciated benefit of using benchmarks for growth. A 2% monthly improvement in conversion rate, sustained over twelve months, produces a materially different business than a team that hits 10% once and then plateaus. Benchmarks make that compounding visible, which keeps teams motivated and focused on the right levers.
Key Takeaways
Setting data benchmarks is the most direct way to convert raw performance data into compounding, measurable growth across acquisition, retention, and decision speed.
| Point | Details |
|---|---|
| Benchmarks create accountability | Teams with defined performance metrics own their numbers and respond faster to changes. |
| Continuous beats periodic | Weekly benchmarking catches problems before they scale into financial losses. |
| Internal baselines outperform external | Beating your own prior performance compounds faster than chasing industry averages. |
| Clean data before complexity | Simple, consistent measurement produces more reliable signals than early-stage BI infrastructure. |
| Leadership clarity drives results | When executives align on which metrics matter, benchmarking produces focused, measurable outcomes. |
Why most organizations get benchmarking wrong
Most organizations I have worked with do not fail at benchmarking because of bad technology. They fail because leadership cannot agree on which three metrics actually matter. The result is a dashboard with forty KPIs, weekly arguments about which number to trust, and teams optimizing for whatever metric makes their department look best.
The fix is not a better analytics platform. The fix is a leadership conversation that happens before any data is collected. Companies often fail at data-driven growth due to unclear leadership priorities, not technology limitations. I have seen this play out repeatedly: a team invests six months building a measurement infrastructure, then discovers that the CEO and the VP of Growth define "active user" differently. Every benchmark they built is now unreliable.
What actually works is starting with one or two metrics that everyone agrees reflect real business health. Measure them weekly. Build a twelve-week history. Then add complexity. The teams that do this consistently are the ones that show up in the data with 50% acquisition lifts and insight cycles measured in weeks, not quarters.
The shift from periodic to continuous benchmarking is also harder than it sounds. It requires someone to own the process, not just the dashboard. Ownership means flagging anomalies, asking why a number moved, and pushing for an answer before the next week's review. That discipline, applied consistently, is what separates organizations that grow from organizations that just measure.
— Jeff
How Sim2coursecaddie applies data benchmarking to performance
Sim2coursecaddie is built on the same principle that drives business benchmarking: consistent, standardized data collection produces the signals that lead to real improvement. The app imports shot data from any golf simulator, tracks performance trends over time, and delivers AI-driven recommendations based on your actual historical baseline, not generic averages.

For business leaders and analysts who understand the value of weekly performance comparisons, Sim2coursecaddie applies that same logic to on-course decision-making. Every session becomes a data point. Every data point builds a benchmark. Every benchmark drives a better decision. Explore how data-driven club selection works in practice, or visit Sim2coursecaddie to see the full feature set at no cost.
FAQ
What is a data benchmark in business?
A data benchmark is a specific, agreed-upon reference point used to measure whether performance is improving or declining over time. It transforms raw metrics into meaningful signals by providing a consistent standard for comparison.
Why do data benchmarks accelerate growth?
Benchmarks accelerate growth by making performance changes visible and measurable, which enables faster decisions and faster corrections. Organizations using unified analytics environments have reported a 50% lift in acquisition rates by tracking cohort quality signals against clear baselines.
How often should organizations review their benchmarks?
Growth teams should review key benchmarks weekly to catch performance drops before they scale. The benchmarks themselves should be reassessed quarterly to confirm they still reflect the business's current strategic priorities.
What is the difference between internal and external benchmarking?
Internal benchmarking compares current performance against your own historical baseline. External benchmarking compares against industry averages. Internal benchmarks produce faster compounding gains because they reflect your actual business conditions rather than someone else's.
What is the biggest mistake in setting performance metrics?
The most common mistake is measuring activity metrics instead of outcome metrics. Page views and emails sent do not reflect business health. Conversion rate, retention, and revenue per customer do.