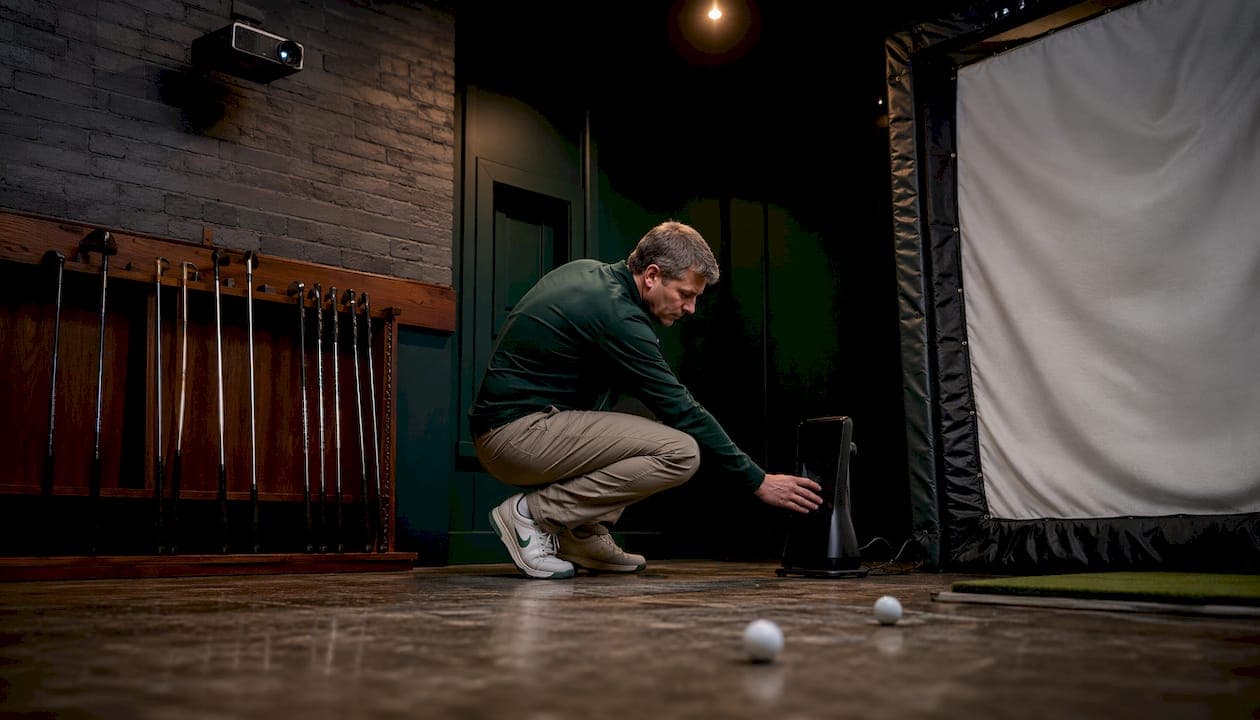
A repeatable home simulator analytics workflow captures synchronized launch-monitor shot data and at least one high-speed swing video, runs a short preprocessing step to filter and tag shots and then feeds an automated dashboard that visualizes your KPIs and archives sessions for trend analysis. Once the pipeline is in place, this process allows rapid buildup from first swing to first insight.
TL;DR:
- Hardware essentials: A launch monitor matched to your room depth (photometric for rooms under 15 feet, radar for longer bays), one high-speed camera, and a short-throw projector.
- Minimal sync step: Use a manual clap or consistent file-naming convention to align video frames with shot records before any analysis.
- First automation to implement: Set up an auto-import folder that pulls your launch-monitor CSV or JSON on session end, then generate a one-click session summary.
Start right now by measuring your bay depth. That single number determines whether a photometric or radar system will give you reliable spin and launch data, and every other hardware decision follows from it.
Table of Contents
- What hardware does your room actually need?
- How do you capture clean, synchronized swing data?
- How do you clean and validate session data before analysis?
- Which metrics actually move the needle for swing improvement?
- How does Sim2coursecaddie automate the import-to-dashboard pipeline?
- What does a complete session script look like?
- How do you build long-term trend data from session archives?
- Calibration issues and how to fix them fast
- Key Takeaways
- Why most home simulator setups never produce useful data
- Sim2coursecaddie puts the whole workflow in one place
- Useful sources
What hardware does your room actually need?
Room size is the non-negotiable constraint in any home simulator setup. Buy the wrong sensor type for your bay and no amount of software will fix the data.
Room measurement checklist
Measure three numbers before you buy anything:
- Bay depth (back wall to impact screen): the critical dimension
- Ceiling height at the hitting position
- Bay width at the widest usable point
The decision rule is straightforward: radar-based launch monitors need sufficient ball flight distance to calculate accurate spin and launch angle. In rooms with limited depth, a photometric (camera-based) system is usually the only reliable choice for spin accuracy. Photometric units track impact and launch angles directly at the ball, so they work well in tight spaces. Radar units placed too close to the screen will consistently underread spin.
Hardware checklist by tier
| Component | Budget Tier | Mid Tier | Pro Tier |
|---|---|---|---|
| Launch monitor | Entry photometric | Mid-range photometric or radar | Dual-tech or overhead camera |
| Camera | webcam | dedicated cam | 4K camera with external trigger |
| Impact screen | Basic nylon | Woven polyester, 4K-ready | Commercial-grade, curved |
| Projector | HD resolution, standard lumens projector | HD short-throw projector | 4K short-throw projector |
| PC/device | Mid-range Windows laptop | Dedicated Windows desktop | High-spec desktop, SSD RAID |
| Hitting mat | Basic rubber-backed | Replaceable-insert turf mat | Tour-quality, multi-surface |
| Time to first valid session | A few hours | A weekend | 2–3 weekends |
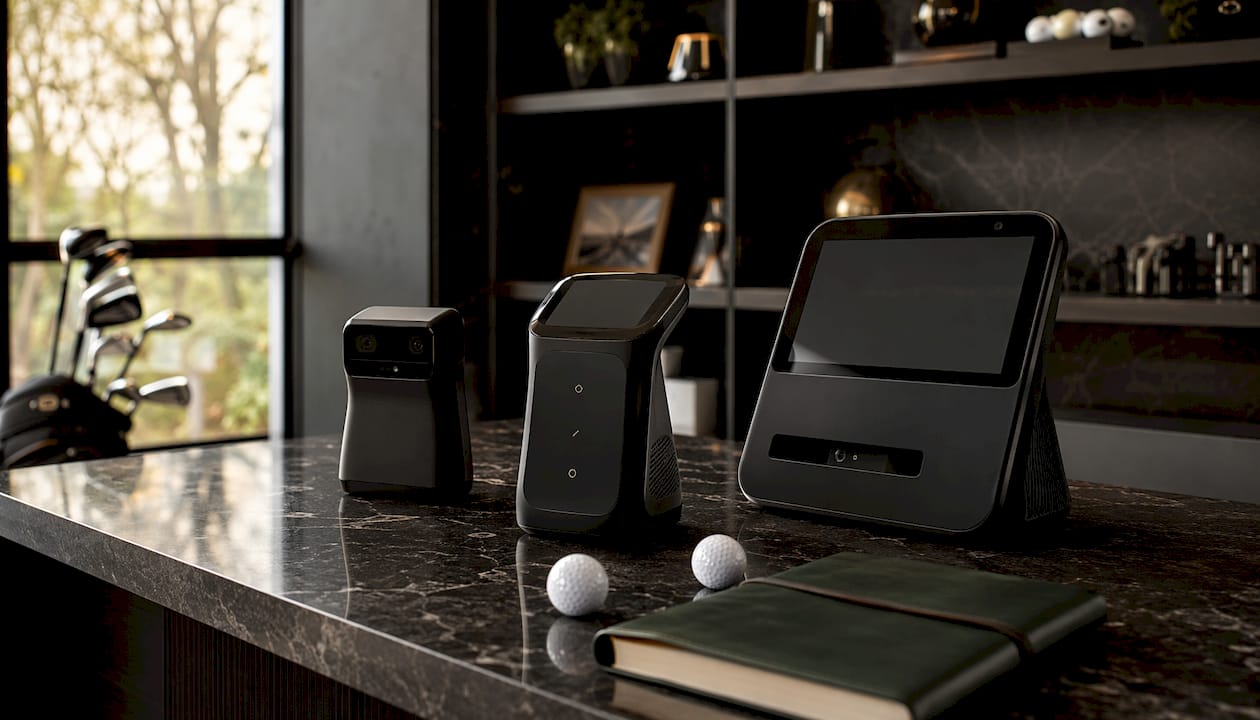
Short-throw projectors with throw ratios of 0.5–0.8 mounted in front of the golfer reduce the shadow effect that degrades both immersion and video-based swing analysis. A standard long-throw projector positioned behind the golfer often casts a shadow across the screen during the swing; that shadow can degrade overhead camera footage and make video sync unreliable.
Software compatibility matters as much as hardware specs. Some popular simulation platforms are PC-only or require a specific launch monitor. Confirm that your chosen software supports your launch monitor model before committing to either purchase.
Pro Tip: The most common purchase mistake is prioritizing advertised specs or price over system compatibility. Measure your room, confirm your ceiling height, then pick a sensor type. Buy the launch monitor second, the projector third.
How do you capture clean, synchronized swing data?
Clean raw data is the foundation of any useful analytics workflow. Garbage in, garbage out applies here more than anywhere else in the pipeline.
Camera angles and placement
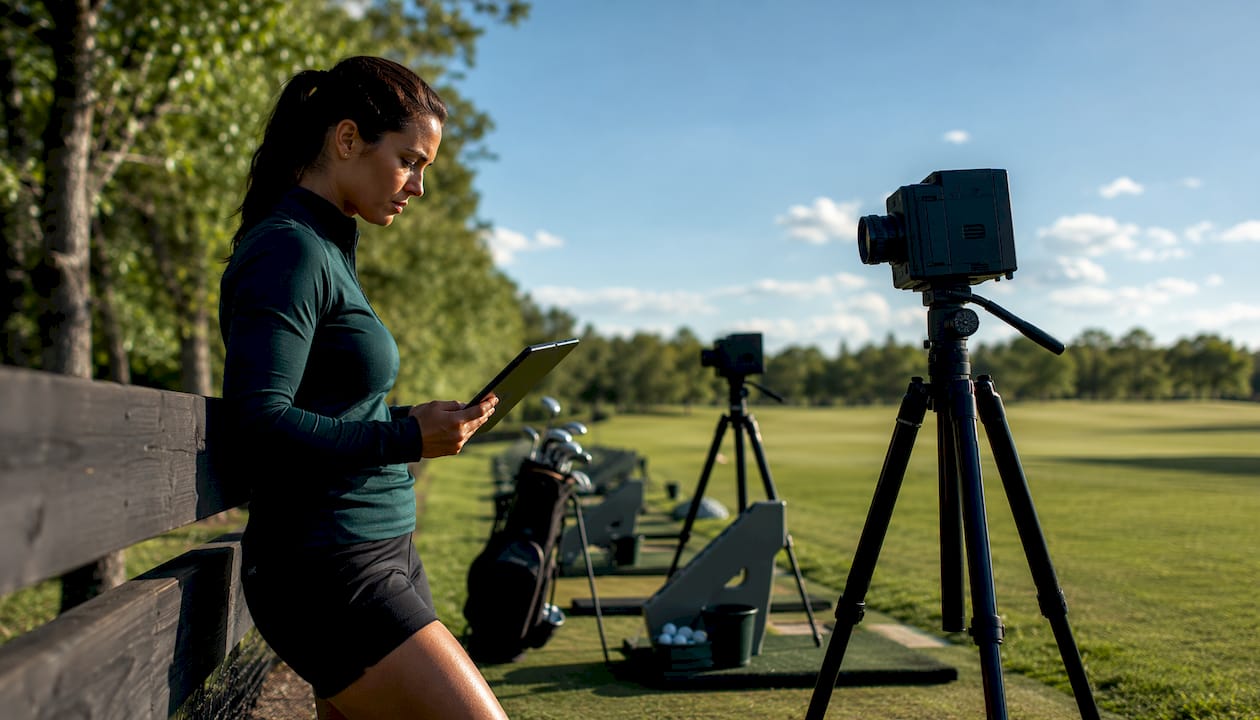
Three angles give you a complete picture:
- Down-the-line (DTL): Camera positioned behind the golfer, aligned with the target line. Captures club path, shaft lean at impact, and follow-through. Mount at hip height, roughly 8–10 feet behind the hitting position.
- Face-on: Camera positioned directly in front of the golfer (or behind the screen if your enclosure allows a cutout). Captures lateral sway, hip slide, and head position. Mount at belt height.
- Overhead (optional): A ceiling-mounted camera captures shoulder rotation and foot alignment. Requires a minimum ceiling height of about 10 feet for useful framing.
Launch monitor placement rules
Photometric systems sit beside or just behind the ball at impact, typically 6–12 inches to the side. Radar units need to be placed behind the golfer with enough room for the ball to travel 8–10 feet before the signal is reliable. Never place a radar unit closer to the screen than the manufacturer's minimum flight distance.
Camera settings: minimums vs. recommended
| Setting | Minimum | Recommended |
|---|---|---|
| Resolution | HD resolution | HD resolution or 4K |
| Frame rate | high frame rate | very high frame rate |
| Shutter speed | fast shutter speed | very fast shutter speed |
| Lighting | Natural + overhead | Dedicated LED panels |
| File format | MP4 format | MP4 or MOV format |
Sync checklist and shot labeling
Aligning video with launch-monitor records is the step most golfers skip, and it is the one that makes post-session review actually useful.
- Use a manual clap or a single hand-clap visible on camera at the start of each recording to create a sync point.
- Name every video file with the session date, club, and take number:
20260615_7iron_take01.mp4. - Export launch-monitor data immediately after the session in CSV or JSON format with the same date prefix.
- During the session, tag each shot with a short label: drill name, club, intended target, and a one-word note (solid, thin, push, pull).
A consistent shot-labeling template during the session saves 20–30 minutes of cleanup afterward and makes automated filtering far more reliable.
How do you clean and validate session data before analysis?
Raw session data always contains noise. Mishits, practice swings, and multi-ball strikes produce readings that will skew your averages and mislead your trend analysis if you leave them in.
Filtering checklist
Before any analysis, run through these steps:
- Remove shots flagged by the launch monitor as "no read" or "partial read."
- Filter out ball speeds below a reasonable floor for the club (for example, below 80 mph for a driver suggests a mishit or a practice swing).
- Remove shots where spin rate is implausibly high or low for the club and ball speed combination.
- Flag any shot where carry distance deviates more than 20% from your session median for that club.
- Normalize environmental variables: if your bay temperature or humidity changes significantly between sessions, note it in the session metadata.
Aligning video frames with shot records
After filtering, align your video files to the shot log. The manual clap sync point you created during capture gives you a reference frame. Count forward from that frame to each shot using your shot-log timestamps. A cleaned shot record looks like this:
SessionID: 20260615 | Club: 7-iron | BallSpeed: 118 mph | CarryDist: 162 yds | LaunchAngle: 16.2° | SpinRate: 6,840 rpm | ClubPath: +1.8° | FaceAngle: +0.4° | Tag: draw_drill | VideoFrame: 00:04:32
Validation: the three-shot repeatability test
Run 10–15 consistent 7-iron shots and compare the mean carry to a known on-course or launch-monitor baseline. If the simulator reads consistently 10+ yards long or short versus your real-world carry, adjust the launch monitor's placement or software calibration offset before trusting any session output. Three consecutive shots within 3 yards of each other confirm the system is reading consistently. If you cannot hit three in a row within that window, recalibrate before continuing.
Which metrics actually move the needle for swing improvement?
Tracking every metric the launch monitor outputs is a fast way to feel busy without improving. The KPIs below are the ones that connect directly to swing faults and on-course outcomes.
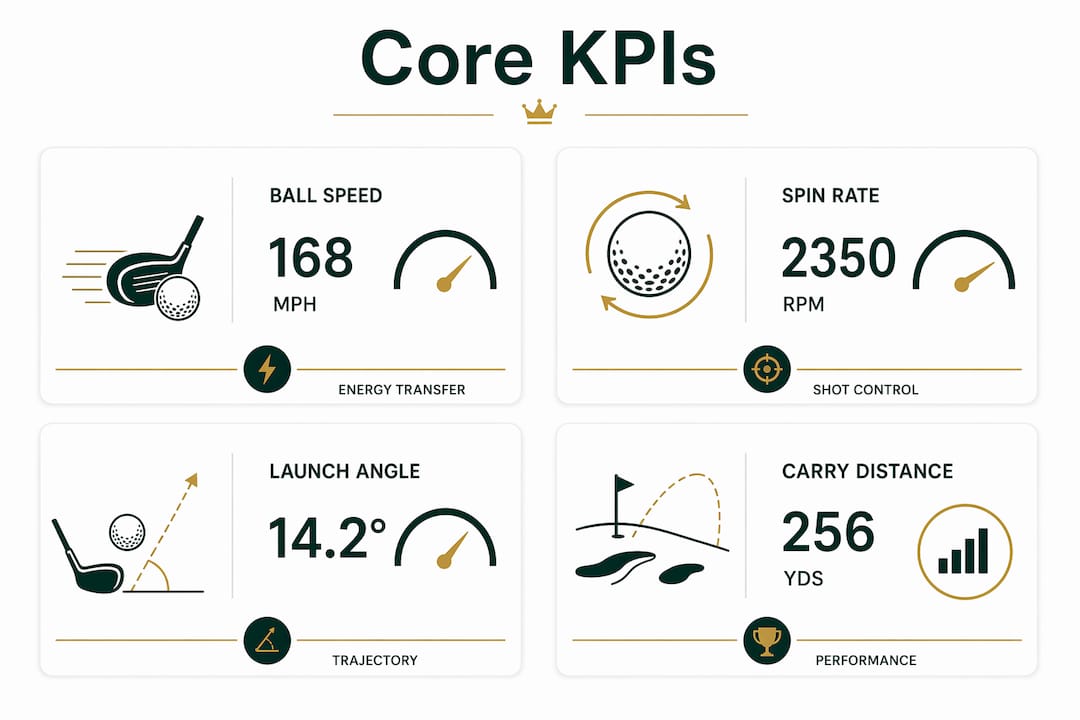
Core KPIs to monitor
| Metric | What it tells you | What to change |
|---|---|---|
| Ball speed | Energy transfer at impact | Strike quality, shaft stiffness |
| Carry distance | Effective power output | Ball speed + launch angle combo |
| Launch angle | Vertical launch off the face | Attack angle, loft at impact |
| Spin rate | Trajectory stability | Strike location, face angle |
| Club speed | Raw power generation | Sequencing, grip pressure |
| Club path | In-to-out vs. out-to-in | Swing plane, setup alignment |
| Face angle | Open/closed at impact | Grip, wrist position |
| Attack angle | Ascending vs. descending | Ball position, weight shift |
| Tempo (backswing:downswing ratio) | Transition timing | Transition drill, pause at top |
Building a session dashboard
A useful golf performance dashboard has four views:
- Quick session summary: median ball speed, median carry, average spin rate, and shot count for each club used.
- Dispersion plot: a top-down scatter of all carry/lateral landing positions, grouped by club and drill.
- KPI time-series: a line chart of your key metrics across the last 8–12 sessions so you can see trends, not just today's numbers.
- Hit-by-hit drill view: a table of every tagged shot in the session, sortable by club, drill, and outcome.
Root-cause checklist
Visual patterns in your data point to specific swing faults. A few common ones:
- Closed face + in-to-out path: produces a draw or hook; check grip and wrist position at the top.
- Open face + out-to-in path: produces a fade or slice; check alignment and takeaway plane.
- High spin + low launch: often a steep attack angle; move ball position forward and shallow the approach.
- Low ball speed relative to club speed: poor energy transfer; check strike location on the face with foot spray or impact tape.
- High tempo variability: inconsistent transition; use a metronome drill at 3:1 backswing-to-downswing ratio.
Dispersion tightens when you fix the root cause rather than the symptom. Chasing carry distance while ignoring face angle is the most common way to spin your wheels for months.
How does Sim2coursecaddie automate the import-to-dashboard pipeline?
Shrinking the delay between strike and analysis turns practice into rapid iterate-and-test learning. Automated imports and instant session summaries are what make that possible at home without a dedicated analyst.
High-level automation flow
The four-phase practical analytics workflow maps directly to an automated pipeline:
- Data capture: Launch-monitor CSV or JSON lands in a watched folder on session end.
- Pre-processing: An automated rule strips no-reads, applies your filter thresholds, and aligns video timecodes.
- Analysis/visualization: The dashboard auto-generates a session summary with dispersion plot and KPI time-series.
- Post-session review: The session is tagged, archived, and added to the trend database.
Sample import recipe
- Create a root folder:
/SimSessions/YYYY/MM/. - Name each session subfolder:
20260615_7iron_drawdrill/. - Drop your launch-monitor export (CSV or JSON) and video files into that subfolder immediately after the session.
- Set your import tool to watch the root folder and trigger on any new subfolder containing a CSV.
- Run the pre-processing filter script (or one-click manual import) to produce a cleaned shot log.
- Open the auto-generated session summary dashboard.
Privacy and export notes
Local storage keeps your swing data entirely on your own machine, which matters if you share a coach or train with a club. Cloud storage adds convenience for remote coach review but introduces access-control considerations. At minimum, password-protect any cloud folder containing session exports. For coach sharing, export a filtered CSV or PDF summary rather than raw session files. That way your full shot log stays private while your coach gets the metrics they need.
Pro Tip: Set up automated performance tracking so your import folder triggers a pre-process script on every new file. You will never sit down to analyze a session and realize the data is still in the launch monitor.
Sim2coursecaddie handles the import, pre-processing, and dashboard generation steps natively. It accepts CSV and JSON exports from any launch monitor, applies your saved filter rules automatically, and generates a session summary with dispersion plot and KPI trends. The AI club-suggestion workflow reads your carry distances and dispersion patterns, then recommends club selections tailored to real course conditions, turning practice data into on-course decisions.
What does a complete session script look like?
A reproducible session script is what separates golfers who accumulate data from golfers who improve from it. Integrating video and launch-monitor data works best when every session follows the same structure, because consistent tagging is what makes automated queries reliable across weeks.
6-step session script
| Step | Activity | 30-min session | typical session length | 90-min session |
|---|---|---|---|---|
| 1. Warmup | 10 swings, no data, loosen up | 5 min | 5 min | 5 min |
| 2. Baseline shots | 5 shots per club, no target pressure | 5 min | 10 min | 10 min |
| 3. Targeted drill | One KPI-focused drill (e.g., draw drill) | 10 min | 20 min | 30 min |
| 4. Simulated play | Play multiple holes with course strategy | 5 min | 15 min | 30 min |
| 5. Quick review | Glance at session summary on screen | 3 min | 5 min | 8 min |
| 6. Archive | Move files to dated folder, add tags | 2 min | 5 min | 7 min |
File naming and folder conventions
Consistent naming is what makes automated imports and trend comparisons reliable across months of sessions:
- Session folder:
YYYYMMDD_[club/focus]_[drill](e.g.,20260615_driver_drawdrill) - Launch-monitor export:
20260615_driver_drawdrill_lm.csv - Video files:
20260615_driver_drawdrill_dtl.mp4,20260615_driver_drawdrill_faceon.mp4
Drill templates tied to KPI goals
- Carry consistency drill: Hit 10 shots with a 7-iron to a single target. Goal: 8 of 10 within 5 yards of median carry. Tracks: carry distance, spin rate.
- Draw drill: Set club path target to +2° to +4° in-to-out. Hit 15 shots. Tracks: club path, face angle, lateral dispersion.
- Tempo drill: Use a metronome app at 72 BPM (3:1 ratio). Hit 10 shots. Tracks: tempo variability, ball speed consistency.
How do you build long-term trend data from session archives?
Single-session data tells you what happened today. Trend data tells you whether you are actually improving. The difference is a consistent post-session review habit and a tagging system that supports automated queries.
Archive folder structure and tagging taxonomy
A simple folder structure that supports automated queries:
/SimSessions/2026/06/20260615_driver_drawdrill/- Tags per session:
date,drill,club,target,weather/temp,notes
Apply tags immediately after the session while the context is fresh. A session tagged three days later is missing half its value.
Trend KPIs to track weekly and monthly
- Weekly: median carry per club, dispersion radius (90th-percentile miss distance from target), tempo variability score.
- Monthly: ball speed trend (are you gaining or losing?), face-angle standard deviation (is it tightening?), carry distance gap between clubs (are your gaps consistent?).
Comparing sessions by drill and club converts noisy short-term variability into meaningful multi-week trends. One bad session is noise. Three bad sessions in a row on the same drill is a signal.
Decision rules: signal vs. noise
- If a KPI moves more than 10% in the wrong direction over three consecutive sessions, change the drill or seek a coaching cue.
- If a KPI improves steadily over four or more sessions, lock in the drill and move focus to the next weakest metric.
- If dispersion is tightening but carry is dropping, you are trading power for control. Decide whether that trade is intentional.
Automate weekly trend emails or dashboard snapshots so the review becomes a habit rather than a chore. A five-minute weekly review of three KPIs beats a two-hour monthly deep-dive you never actually do.
Calibration issues and how to fix them fast
Most data-quality problems in a home simulator come from skipped calibration, not faulty hardware. A few common failure modes account for the majority of bad sessions.
Symptom/fix reference
| Symptom | Likely cause | Fix |
|---|---|---|
| Carry reads 15+ yards long consistently | Radar too close to screen | Move unit back or switch to photometric |
| Spin rate implausibly high on irons | Camera obstruction or dirty lens | Clean lens, check for shadows |
| Shadow on screen during swing | Projector throw angle too steep | Switch to short-throw projector, reposition |
| Video and shot log out of sync | No sync point at recording start | Use manual clap at start of every recording |
| Software won't read launch monitor | Compatibility mismatch | Confirm monitor is on software's supported list |
| Carry varies 20+ yards shot to shot | Mat surface inconsistency | Replace hitting insert, check mat flatness |
| Ball speed drops mid-session | Battery or USB power issue | Use wired power, check USB cable |
Three-shot repeatability test protocol
Run this before every session, not just at initial setup:
- Hit three consecutive 7-iron shots with your normal swing.
- Check that all three carry distances fall within 3 yards of each other.
- If they do not, check the launch monitor's position, clean any camera lenses, and repeat.
- If three attempts still fail the test, stop and recalibrate before collecting any session data.
Trusting factory defaults without this check is the single most common source of systematic bias in home simulator data.
Key Takeaways
A home simulator analytics workflow only produces reliable improvement data when room constraints, hardware choices, and a consistent session script are aligned from the start.
| Point | Details |
|---|---|
| Match sensor to room depth | Use photometric systems for bays under 15 feet; radar needs 8–10+ feet of ball flight for accurate spin. |
| Sync video and shot data every session | A manual clap sync point and consistent file naming make automated alignment reliable across months. |
| Run the three-shot repeatability test | Hit three 7-iron shots within 3 yards of each other before every session to confirm data quality. |
| Track trend KPIs, not just session stats | Weekly median carry, dispersion radius, and face-angle deviation reveal real improvement over noise. |
| Sim2coursecaddie automates the pipeline | Import any launch-monitor CSV, apply saved filter rules, and get an AI-driven session summary and club suggestions for free. |
Why most home simulator setups never produce useful data
The gap between owning a simulator and actually improving from one is wider than most golfers expect. The hardware is the easy part. The workflow is where most setups quietly fail.
Here is what gets overlooked: a launch monitor sitting in a garage bay, even a good one, produces nothing useful without a consistent capture-to-archive routine. Golfers hit balls, glance at the screen, and move on. The data evaporates. Three months later they have no idea whether they improved, regressed, or just got better at hitting the mat.
The conventional wisdom says "get a better launch monitor." The real fix is almost always "build a five-minute post-session routine." Tagging, archiving, and comparing sessions by drill and club is what converts raw numbers into a coaching signal. Without that, even a pro-level photometric system is just an expensive scoreboard.
The other thing worth saying plainly: the automation step is not optional for busy golfers. If reviewing data requires opening three different apps and manually exporting files, it will not happen consistently. The feedback loop needs to be short enough that you actually close it. Automated imports and one-click session summaries are not a luxury feature. They are the difference between a workflow you use every week and one you abandon after the first month.
Sim2coursecaddie puts the whole workflow in one place
If the pipeline above sounds like a lot to wire together manually, Sim2coursecaddie removes most of that friction. It imports shot data from any golf simulator, applies your saved preprocessing rules automatically, and generates a session summary with a 3D dispersion view and KPI trends without a subscription fee.
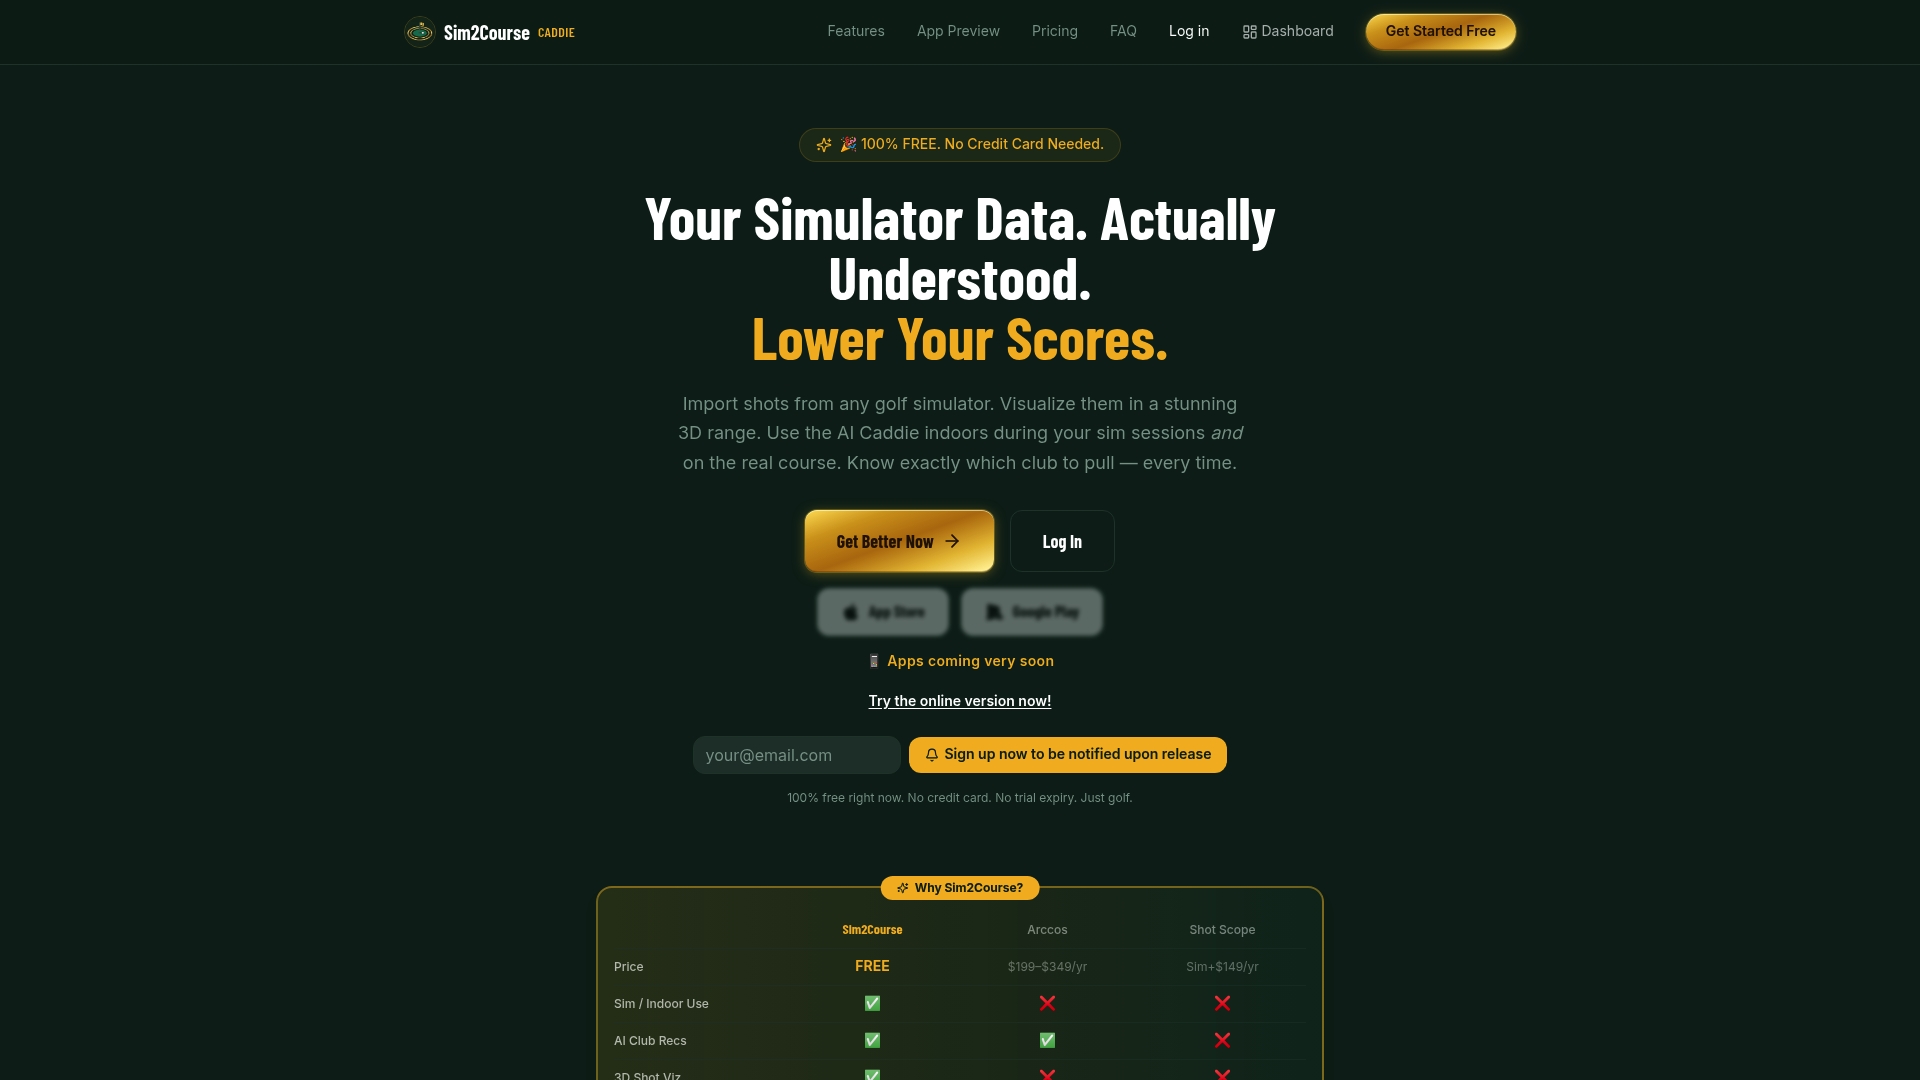
Getting started takes four steps: import a sample CSV from your launch monitor, connect your video folder, let the auto-preprocess run, and open the generated dashboard. From there, the AI-driven club suggestions read your real carry distances and dispersion patterns and recommend club selections matched to actual course conditions, so your practice data starts influencing your on-course decisions directly.
The free analytics experience covers multi-simulator import, session tagging, trend dashboards, and export options for coach sharing. No hardware required, no monthly fee. If you have been collecting session data and not doing much with it, that is the place to start.
Useful sources
These references support the technical claims in this article and are worth bookmarking for follow-up research on specific topics.
- Room sizing and sensor type decision: Golf Simulator Setup Guide, Home Performance Lab covers photometric vs. radar placement in detail, including minimum flight distances.
- Build sequence and compatibility: How to Build a Home Golf Simulator, T5 Golf walks through the ordered build sequence and warns against buying components without confirming room compatibility.
- Projector placement and shadow mitigation: DIY Golf Simulator Guide, GolfLaunchLab covers short-throw throw ratios, shadow effect causes, and the calibration protocol for 7-iron validation shots.
- Analytics workflow phases and automation rationale: Practical Workflow Phases for Simulation Analytics, NLR describes the four-phase capture-to-review structure and the value of shrinking the delay between strike and analysis.
- Multi-stream data integration and tagging: Leveraging Extreme-Scale Simulation Data: A Workflow Framework, Cambridge/Design Society provides the research basis for standardized tagging and consistent post-session review habits.
- Sim2coursecaddie documentation and free analytics: Free Analytics landing page for import setup, dashboard templates, and getting-started documentation.
- Shot-by-shot logging formats: Shot-by-Shot Data Logging: A Golfer's 2026 Guide covers export schemas and how to prepare data for analytics pipelines.
- Session history organization: Organize Your Home Simulator Session History Effectively for folder structures, tagging taxonomies, and session metadata conventions.