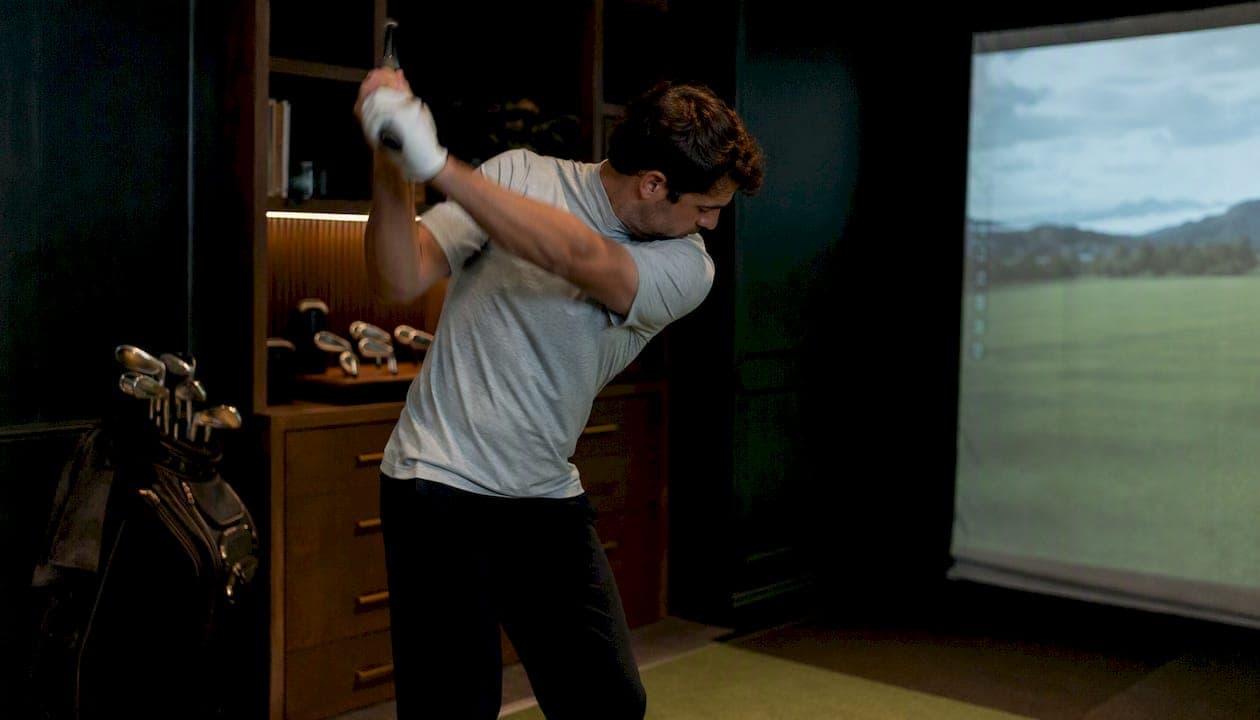
The best ready-to-try examples of 3D swing visualization tools are: Sim2coursecaddie (no extra hardware required), golf-shot-viz and Golf Flight Visualizer (open-source React/Three.js demos), the swing-stack GitHub reference for video-to-3D pose pipelines using SwingNet, HRNet, and MHFormer, and planning tools like ProVisualizer for course-strategy overlays.
Quick map: if you want a polished app with no setup, Sim2coursecaddie is the fastest path. If you have a launch monitor and want to tinker with code, golf-shot-viz gives you a working Three.js renderer in minutes. If you only have phone video, the SwingNet/HRNet/MHFormer pipeline reconstructs 3D poses from a single camera. Developers who want a physics-simulated demo should look at the Golf Flight Visualizer project first.
Understanding data visualization in golf performance is the foundation for getting real value from any of these tools.
Table of Contents
- What Sim2coursecaddie brings to serious golfers
- Open-source libraries and demos you can run or fork
- Where 3D visualizers actually get their data
- How to choose the right 3D swing visualization approach
- What a minimal React/Three.js visualizer actually looks like
- Key Takeaways
- The gap between what 3D visualization promises and what actually moves your game
- Sim2coursecaddie gives you 3D visualization without the hardware cost
- Useful links and references
What Sim2coursecaddie brings to serious golfers
Sim2coursecaddie is a freemium iOS and web app that imports shot data from any launch monitor or simulator, then renders it in a 3D driving range with dispersion overlays, distance trends, and AI-driven club recommendations tied to live GPS and real-time course conditions.
| Feature | What it does |
|---|---|
| 3D shot visualization | Renders measured trajectories in a navigable 3D range |
| Launch monitor import | Accepts CSV exports from any simulator or monitor |
| Dispersion overlays | Shows shot scatter patterns by club |
| AI club recommendations | Suggests clubs based on your data and live course conditions |
| Mobile/web access | iOS app and browser, no additional hardware needed |
| Pricing | Free tier for analytics; Pro available with subscription options |
The typical workflow: hit a session on your home simulator, export the CSV, import it into Sim2coursecaddie, and review your 3D dispersion before your next round. The Pro tier adds a live GPS caddie that pulls those same dispersion patterns into real-time recommendations on the course.
Pro Tip: Export your last 30 sessions as a single CSV and import them together. Sim2coursecaddie's dispersion view will show you long-term scatter trends by club, not just a single session snapshot, which is where the real patterns appear.
Open-source libraries and demos you can run or fork
Three concrete GitHub projects cover the main approaches developers and technically curious golfers will want to explore.
| Project | Tech stack | Data type | Live demo |
|---|---|---|---|
| golf-shot-viz | Three.js, React, TypeScript | Measured launch monitor data | GitHub repo |
| Golf Flight Visualizer | React Three Fiber, Three.js | Physics-simulated parameters | Live demo available |
| swing-stack / pose pipeline | SwingNet, HRNet, MHFormer | Single-camera video | Research repo |
golf-shot-viz reads real recorded flight paths from launch monitor exports and replays them with reconstructed timing. It ships with a TrackMan adapter and a React wrapper, so you can drop measured shot arrays into a Three.js scene without writing the renderer from scratch. Fidelity is high because it skips physics entirely and renders what the monitor actually measured.
Golf Flight Visualizer takes the opposite approach: it simulates ball flight from adjustable club-face angle, club path, ball speed, and launch angle using React Three Fiber. You get a real-time moving ball and tracer path you can tweak interactively. Great for understanding how face-to-path relationships curve the ball, less useful for analyzing your actual shots.
The MLB Swing Path Visualizer at swingpath.streamlit.app uses Hermite interpolation and Plotly 3D plots to render bat swing arcs from Statcast data. The pattern transfers directly to golf: smooth arc generation, Streamlit front end, and physics-based splines are all reusable concepts for a golf prototype.
For course-strategy visualization rather than swing mechanics, ProVisualizer offers 2D/3D planners with Google Earth integration for competitive golfers mapping approach angles and yardage charts.
Pro Tip: Build a golf performance dashboard from your home sim data before diving into raw Three.js code. You'll understand which metrics matter before you write a single line of renderer logic.
Where 3D visualizers actually get their data
The input source determines everything about fidelity. Measured launch monitor data produces the most accurate 3D trajectories because the hardware captures real ball and club telemetry. Simulator exports are the next tier: they compute physics from launch parameters, which is useful for scenario planning but not identical to a measured outdoor shot. Single-camera video is the most accessible entry point and the lowest in absolute accuracy.
| Input type | Key data points | Ballpark cost |
|---|---|---|
| TrackMan radar | Ball speed, spin rate, launch angle, club path, face angle | $20,000+ (pro); rental available |
| Foresight GCQuad | Ball speed, spin axis, launch angle, carry distance | — |
| Mevo+ / Rapsodo | Ball speed, launch angle, spin, club ID | — |
| Garmin Approach R10 | Ball speed, launch angle, club speed, carry | — |
| Simulator CSV export | Varies by platform; usually ball speed, carry, club | Included with simulator |
| Single-camera video | Pose keypoints (no ball telemetry) | Phone only |
Shot Pattern demonstrates what dispersion overlays can do with launch monitor uploads: it layers tee shot arcs and approach circles over course maps and computes strokes-gained projections from your actual scatter data. That kind of course-strategy output is only possible when the underlying data is measured, not simulated.
Pro Tip: For video-based pose pipelines, shoot from a fixed tripod at 60fps or higher, directly face-on or down-the-line. Diagonal angles introduce depth ambiguity that even MHFormer cannot fully resolve.
How to choose the right 3D swing visualization approach
Rule of thumb: if your goal is on-course decision support, use an app with measured data. If it's swing mechanics coaching, use a launch monitor or two-camera setup. If you're prototyping, start with an open-source demo.
- Evaluate coaching-share features — Coaches need replay controls, multi-angle views, and overlay exports. A raw GitHub demo won't have those; a polished app will.
For tracking improvement over time, the tool needs to store historical sessions, not just render the current one.
What a minimal React/Three.js visualizer actually looks like
A working renderer needs surprisingly little code if the data is shaped correctly. The minimal shot array looks like this:
interface ShotInput {
  id: string;
  clubId: string;
  timestamps: number[];       // ms from impact
  positions: [number, number, number][]; // x, y, z in yards
  ballSpeedMph: number;
}
A React component receives shots: ShotInput[] as a prop, maps each shot to a Three.js TubeGeometry or Line, and colors it by clubId. Replay is a useFrame loop that advances a playhead index through the timestamps array.
The adapter pattern from golf-shot-viz is the cleanest reference: one pure function converts a TrackMan export row into a ShotInput, keeping the renderer completely agnostic about the monitor brand.
The key architectural decision is keeping the adapter layer separate from the renderer. When you add a second launch monitor format, you write one new adapter function, not a new renderer.
Pro Tip: Use Three.js InstancedMesh for the ball tracer points instead of individual sphere meshes. Once you exceed 200 shots in a session, individual meshes will drop your frame rate noticeably on mobile WebGL.
Key Takeaways
Measured launch monitor data fed into a 3D visualizer gives you the highest fidelity, but Sim2coursecaddie removes the hardware barrier by accepting imports from any monitor or simulator at no cost.
| Point | Details |
|---|---|
| Best ready-to-use app | Sim2coursecaddie imports any CSV, renders 3D dispersion, and adds AI caddie features for $9.99/year. |
| Best open-source demo | golf-shot-viz renders real measured trajectories with a TrackMan adapter and React wrapper. |
| Video pipeline models | SwingNet + HRNet + MHFormer is the current research standard for single-camera 3D pose reconstruction. |
| Data fidelity hierarchy | Measured launch monitor data outperforms simulated physics; video-derived poses are useful for body mechanics only. |
| Sim2coursecaddie advantage | Free 3D visualization tier with no hardware requirement; Pro GPS caddie unlocks on-course recommendations. |
The gap between what 3D visualization promises and what actually moves your game
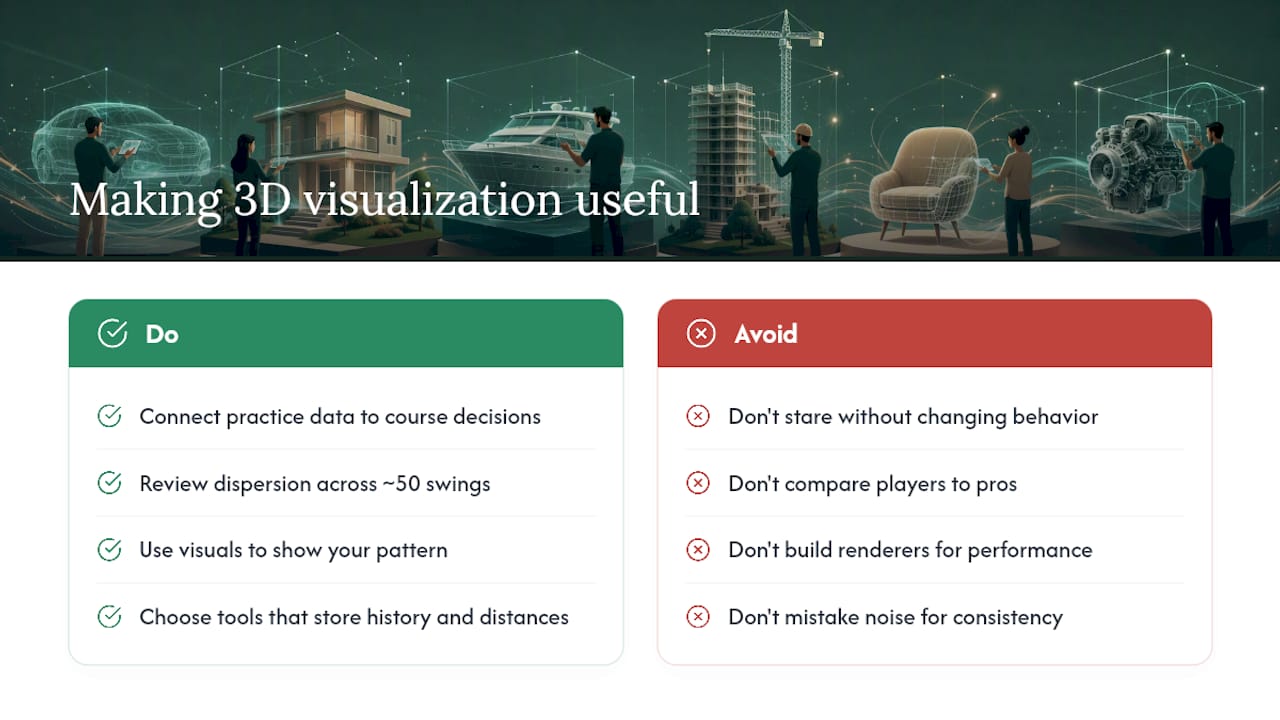
Most golfers who invest in 3D swing tools spend the first month staring at their swing from every angle and the next three months doing nothing differently on the course. The visualization is compelling. The behavior change is hard.
The tools that actually shift performance are the ones that connect practice data to on-course decisions. A 3D dispersion map of your 7-iron is interesting on the range. It becomes useful the moment you're standing 165 yards out with a tight pin and you can recall exactly how wide your scatter pattern runs under pressure. That connection, from practice rep to course decision, is where practice data becomes course strategy.
Coaches who use 3D visualization well don't use it to show players how far they are from a tour swing. They use it to show players their own pattern, repeated across 50 swings, so the player can see what's consistent and what's noise. That's a very different conversation than "your hip rotation is 12 degrees short of Rory's."
The open-source demos in this article are genuinely worth exploring if you have any technical curiosity. But for most golfers, the value isn't in building a renderer. It's in having a tool that already works, already holds your history, and already knows your distances when you walk onto the first tee.
Sim2coursecaddie gives you 3D visualization without the hardware cost
If you've read this far, you know the options: build a Three.js renderer from a GitHub repo, buy a $20,000 TrackMan, or find a tool that already does the hard part.

Sim2coursecaddie handles the 3D rendering, dispersion analysis, and club recommendations without requiring any additional hardware. Import your existing launch monitor or simulator CSV through the raw data import page, and your shots appear in a 3D range immediately. The free tier covers full analytics and 3D visualization. The Pro subscription adds live GPS and real-time club recommendations for every hole you play.
Next steps: download the iOS app or open the web version, import a session CSV, compare two swings side by side in 3D, then activate the 14-day Pro trial before your next round.
Useful links and references
Apps and demos:
- Sim2coursecaddie — free 3D visualization and analytics app
- Golf Flight Visualizer demo — React Three Fiber physics simulation
- Shot Pattern — dispersion overlays and strokes-gained projections
- MLB Swing Path Visualizer — Hermite interpolation demo (transferable pattern)
- ProVisualizer — 2D/3D course planning with Google Earth integration
GitHub repos:
- chayuto/golf-shot-viz — measured-data Three.js renderer with TrackMan adapter
- Kyungseop0206/golf-swing-pose-analysis — SwingNet/HRNet/MHFormer pose pipeline
Technical write-ups:
- Sportsbox AI — commercial single-video 3D swing reconstruction
- Onform: 3D visualization in golf coaching — multi-camera coaching workflows and rotation analysis
- HTK Training: mobility and athletic longevity — physical conditioning context for swing development